Name
基于布林带的趋势跟踪策略Trend-Following-Strategy-Based-on-Bollinger-Bands
Author
ChaoZhang
Strategy Description
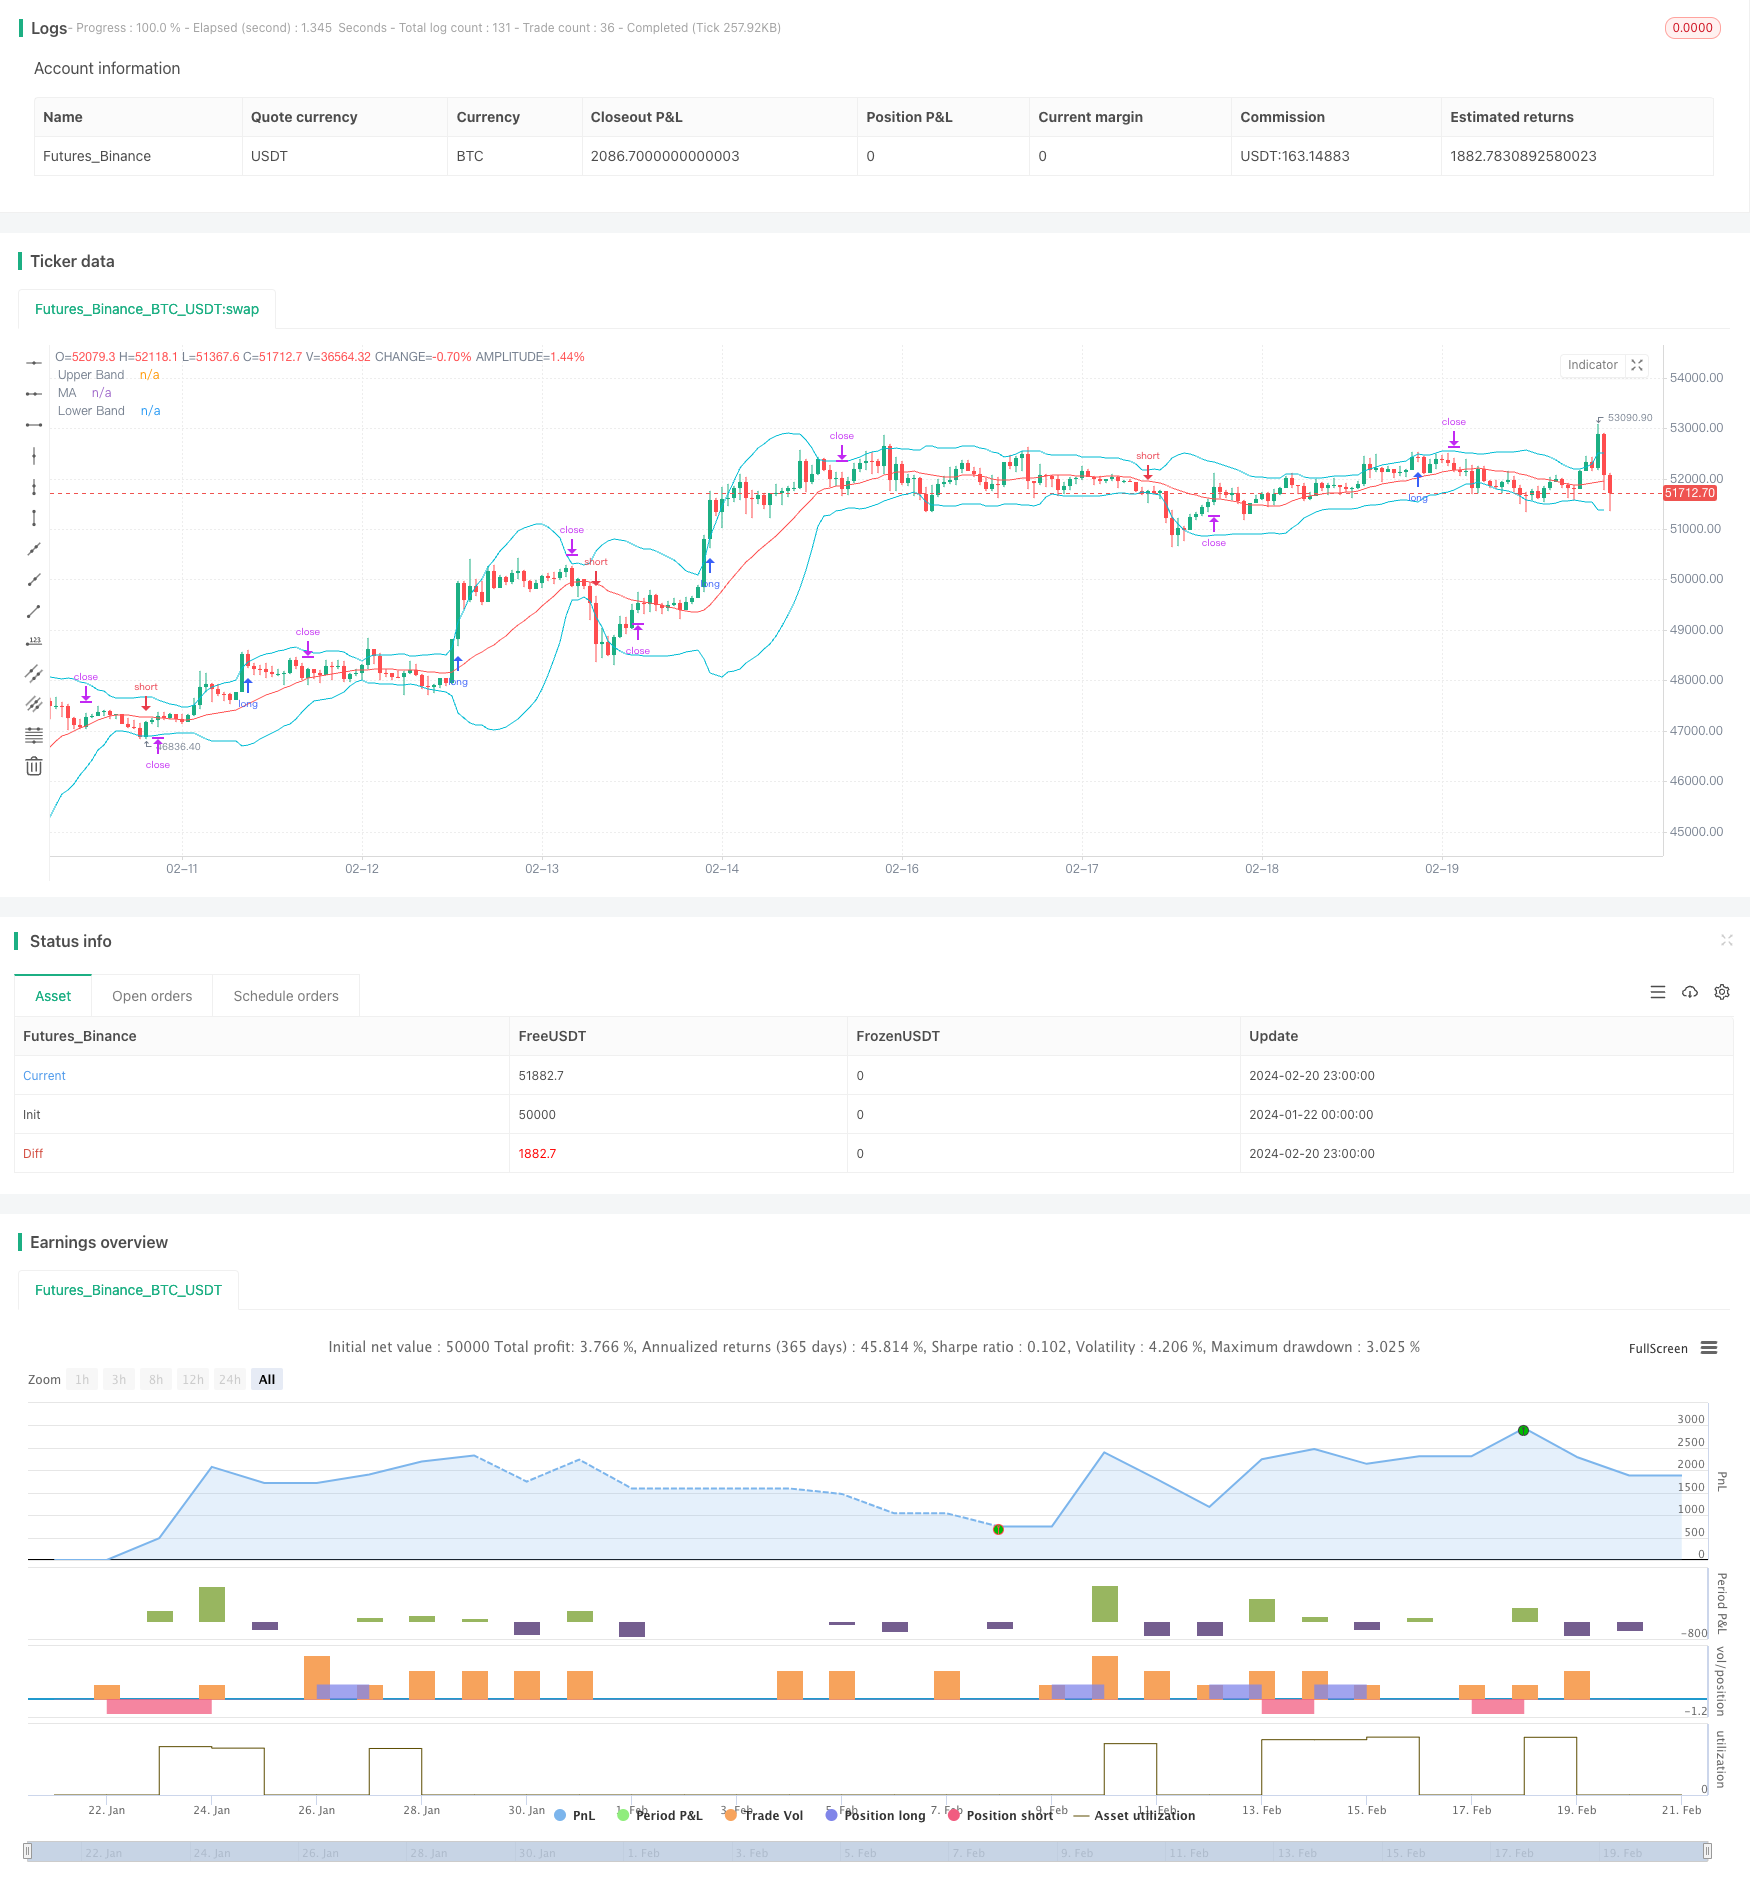
该策略是一个基于布林带指标的趋势跟踪策略。它利用布林带上下轨来判断趋势方向,实现趋势追踪。当价格突破布林带上轨时做多,当价格跌破布林带下轨时做空,止损位则设置在布林带中间轨。
该策略使用布林带指标判断价格趋势。布林带包含上轨、下轨和中间轨三条线。上轨线代表价格的上行极限,下轨线代表价格的下行极限,中间轨代表价格的移动平均线。当价格从下轨突破上轨时,表示开始上升趋势;当价格从上轨突破下轨时,表示开始下跌趋势。
具体来说,该策略判断长仓入场时,需要同时满足以下两个条件:1)当前K线收盘价高于布林带上轨;2)前一根K线的收盘价低于布林带上轨。这表示价格突破上轨,开始上升趋势,做多合适。判断短仓入场也是类似,当前K线收盘价低于布林带下轨并且前一根K线收盘价高于布林带下轨,表示做空时机成熟。
该策略的止损方式是:长仓止损位设置在布林带中间轨,短仓止损位也设置在中间轨。这是因为中间轨代表价格的移动平均线,是判断趋势是否改变的关键位置。
该策略最大的优势在于能清晰判断价格趋势,利用布林带指标的特征实现趋势跟踪,避免被震荡市误导。相比其他指标,布林带对突破判断更加可靠,减少了假突破的概率。
另外,该策略同时设定了多空条件,可以双向交易,最大程度利用价格的上下波动获利。采用中轨作为止损位,可以提高止损精确性,及时止损离场是策略获利的关键。
该策略主要的风险在于布林带的参数设定。布林带中轨时期和标准差大小,会直接影响上下轨的位置。如果参数设置不当,可能导致虚假突破的概率增加。
此外,中间轨作为止损位也存在风险。当行情出现较大波动时,价格可能直接跌破中间轨导致止损。这时就要评估大趋势是否发生转变,必要时可以适当扩大止损范围。
该策略可以从以下几个方面进行优化:
-
优化布林带参数,结合不同周期积累经验数据,设定最佳参数组合。
-
增加成交量的判断指标,避免低量的假突破。可以设定成交量需超过近期平均值才能触发操作。
-
优化止损机制,可以根据市场波动度动态调整止损位。大幅波动时适当放宽止损范围,小幅波动时则缩紧止损追踪价格。
-
增加其他指标判断,如MACD、KDJ等,结合更多因素决定入场时机,提高操作准确性。
本策略总体来说是一个较为实用的趋势跟踪策略。它利用布林带指标判断趋势方向,通过价格突破上下轨来发出操作信号,双向交易以最大限度捕捉价格波动。策略优化空间较大,通过参数优化、止损优化等手段可以获得更好的效果。
||
This strategy is a trend following strategy based on the Bollinger Bands indicator. It utilizes the upper and lower bands of Bollinger Bands to determine trend direction and implement trend tracking. It goes long when price breaks through the upper band and goes short when price breaks through the lower band. The stop loss is set at the middle band of Bollinger Bands.
This strategy uses the Bollinger Bands indicator to determine price trend. Bollinger Bands contain three lines - upper band, lower band and middle band. The upper band represents the upside limit of price, the lower band represents the downside limit of price, and the middle band represents the moving average line of price. When price breaks through upper band from lower band, it signals an upward trend start. When price breaks through lower band from upper band, it signals a downward trend start.
Specifically, the long entry conditions of this strategy are: 1) the close price of the current candle is higher than the upper band; 2) the close price of the previous candle is lower than the upper band. This signals that price has broken through and the uptrend begins, so going long is appropriate. The short entry conditions are similar: current candle's close price is below lower band and previous candle's close price is above lower band, indicating that going short is ready.
The stop loss mechanism of this strategy sets the stop loss level on the middle band, for both long and short positions. Because the middle band represents the moving average line of price, it is a key level to judge the change in trend.
The greatest strength of this strategy is its ability to identify price trends clearly, using features of Bollinger Bands indicator to track trends, avoiding misguidance by market swings. Compared with other indicators, Bollinger Bands are more reliable for breakout judging, reducing false breakouts.
In addition, this strategy sets entry rules for both long and short sides, enabling two-way trading to maximize capturing price fluctuations. Adopting the middle band as stop loss level can improve loss cut accuracy. Timely stop loss is crucial for strategy profitability.
The main risk of this strategy lies in Bollinger Bands parameter configuration. The moving average period and standard deviation size of Bollinger Bands will affect directly the position of upper and lower bands. Improper parameter settings may lead to increased rate of false breakouts.
Besides, using middle band as stop loss level also has risk itself. When market experiences sharp fluctuations, price could break through the middle band abruptly, triggering stop loss. Then we need to evaluate if there is a major trend reversal, and expand the stop loss range accordingly as needed.
This strategy can be improved from the following aspects:
-
Optimize Bollinger Bands parameters. Accumulate empirical data with different periods to find the best parameter combination.
-
Add volume checking rules to avoid false breakout under light trading volume scenarios. Can set threshold of trading volume needing to exceed recent average value before triggering orders.
-
Refine stop loss mechanism by adjusting stop loss level dynamically based on market volatility degree. widen stop loss range under high volatility and narrow it under low volatility.
-
Incorporate judgement from more indicators like MACD, KDJ to help determine entry timing, enhancing operation accuracy.
In conclusion, this is a practical trend following strategy generally. It identifies trend direction using Bollinger Bands indicator and triggers orders when price breaks through upper or lower bands. Two-way trading helps maximizing capturing of price movements. There is large room for strategy optimization through parameter tuning, stop loss refining etc for better results.
[/trans]
Strategy Arguments
| Argument | Default | Description |
|---|---|---|
| v_input_1 | 20 | Length |
| v_input_2 | 2 | StdDev |
| v_input_3 | true | Enable Long Entrys |
| v_input_4 | true | Enable Short Entrys |
Source (PineScript)
/*backtest
start: 2024-01-22 00:00:00
end: 2024-02-21 00:00:00
period: 1h
basePeriod: 15m
exchanges: [{"eid":"Futures_Binance","currency":"BTC_USDT"}]
*/

// © Valente_F
//@version=4
strategy(title="Strategy: Trend Following Bollinger Bands", shorttitle="Strategy: Trend Following Bollinger Bands", overlay = true, pyramiding = 0, default_qty_type = strategy.percent_of_equity)

//Inputs
//Bollinger Bands Parameters
length = input(defval=20, minval=1, title= "Length")
stddev = input(defval=2, minval=0.5, title= "StdDev")

// STRATEGY INPUTS
//Entry and Exit Parameters
checkbox1 = input(true, title="Enable Long Entrys")
checkbox2 = input(true, title="Enable Short Entrys")


//Bollinger Bands Calculation

[middle, upper, lower] = bb(close, length, stddev)

//Long Conditions

bulls1 = close > upper
bulls2 = close[1] < upper[1]
bulls = bulls1 and bulls2

//Short Conditions

bears1 = close < lower
bears2 = close[1] > lower[1]
bears = bears1 and bears2

// Plots of Bollinger Bands
plot(upper, title = "Upper Band", color = color.aqua)//, display = display.none)
plot(middle, title = "MA", color = color.red)//, display = display.none)
plot(lower, title = "Lower Band", color = color.aqua)//, display = display.none)

neutral_color = color.new(color.black, 100)
barcolors = bulls ? color.green : bears ? color.red : neutral_color

//Paint bars with the entry colors
barcolor(barcolors)

//Strategy


//STRATEGY LONG
long_entry = bulls and checkbox1

long_entry_level = high

strategy.entry("Long", true, stop = long_entry_level, when = long_entry)
strategy.cancel("Long", when = not long_entry)

strategy.exit("Stop Long", "Long", stop = middle)

//STRATEGY SHORT
short_entry = bears and checkbox2

short_entry_level = low

strategy.entry("Short", false, stop = short_entry_level, when = short_entry)
strategy.cancel("Short", when = not short_entry)

strategy.exit("Stop Short", "Short", stop = middle)
Detail
https://www.fmz.com/strategy/442552
Last Modified
2024-02-22 17:21:42
