Name
基于布林带的双轨道突破交易策略Bollinger-Bands-Dual-track-Breakthrough-Strategy
Author
ChaoZhang
Strategy Description
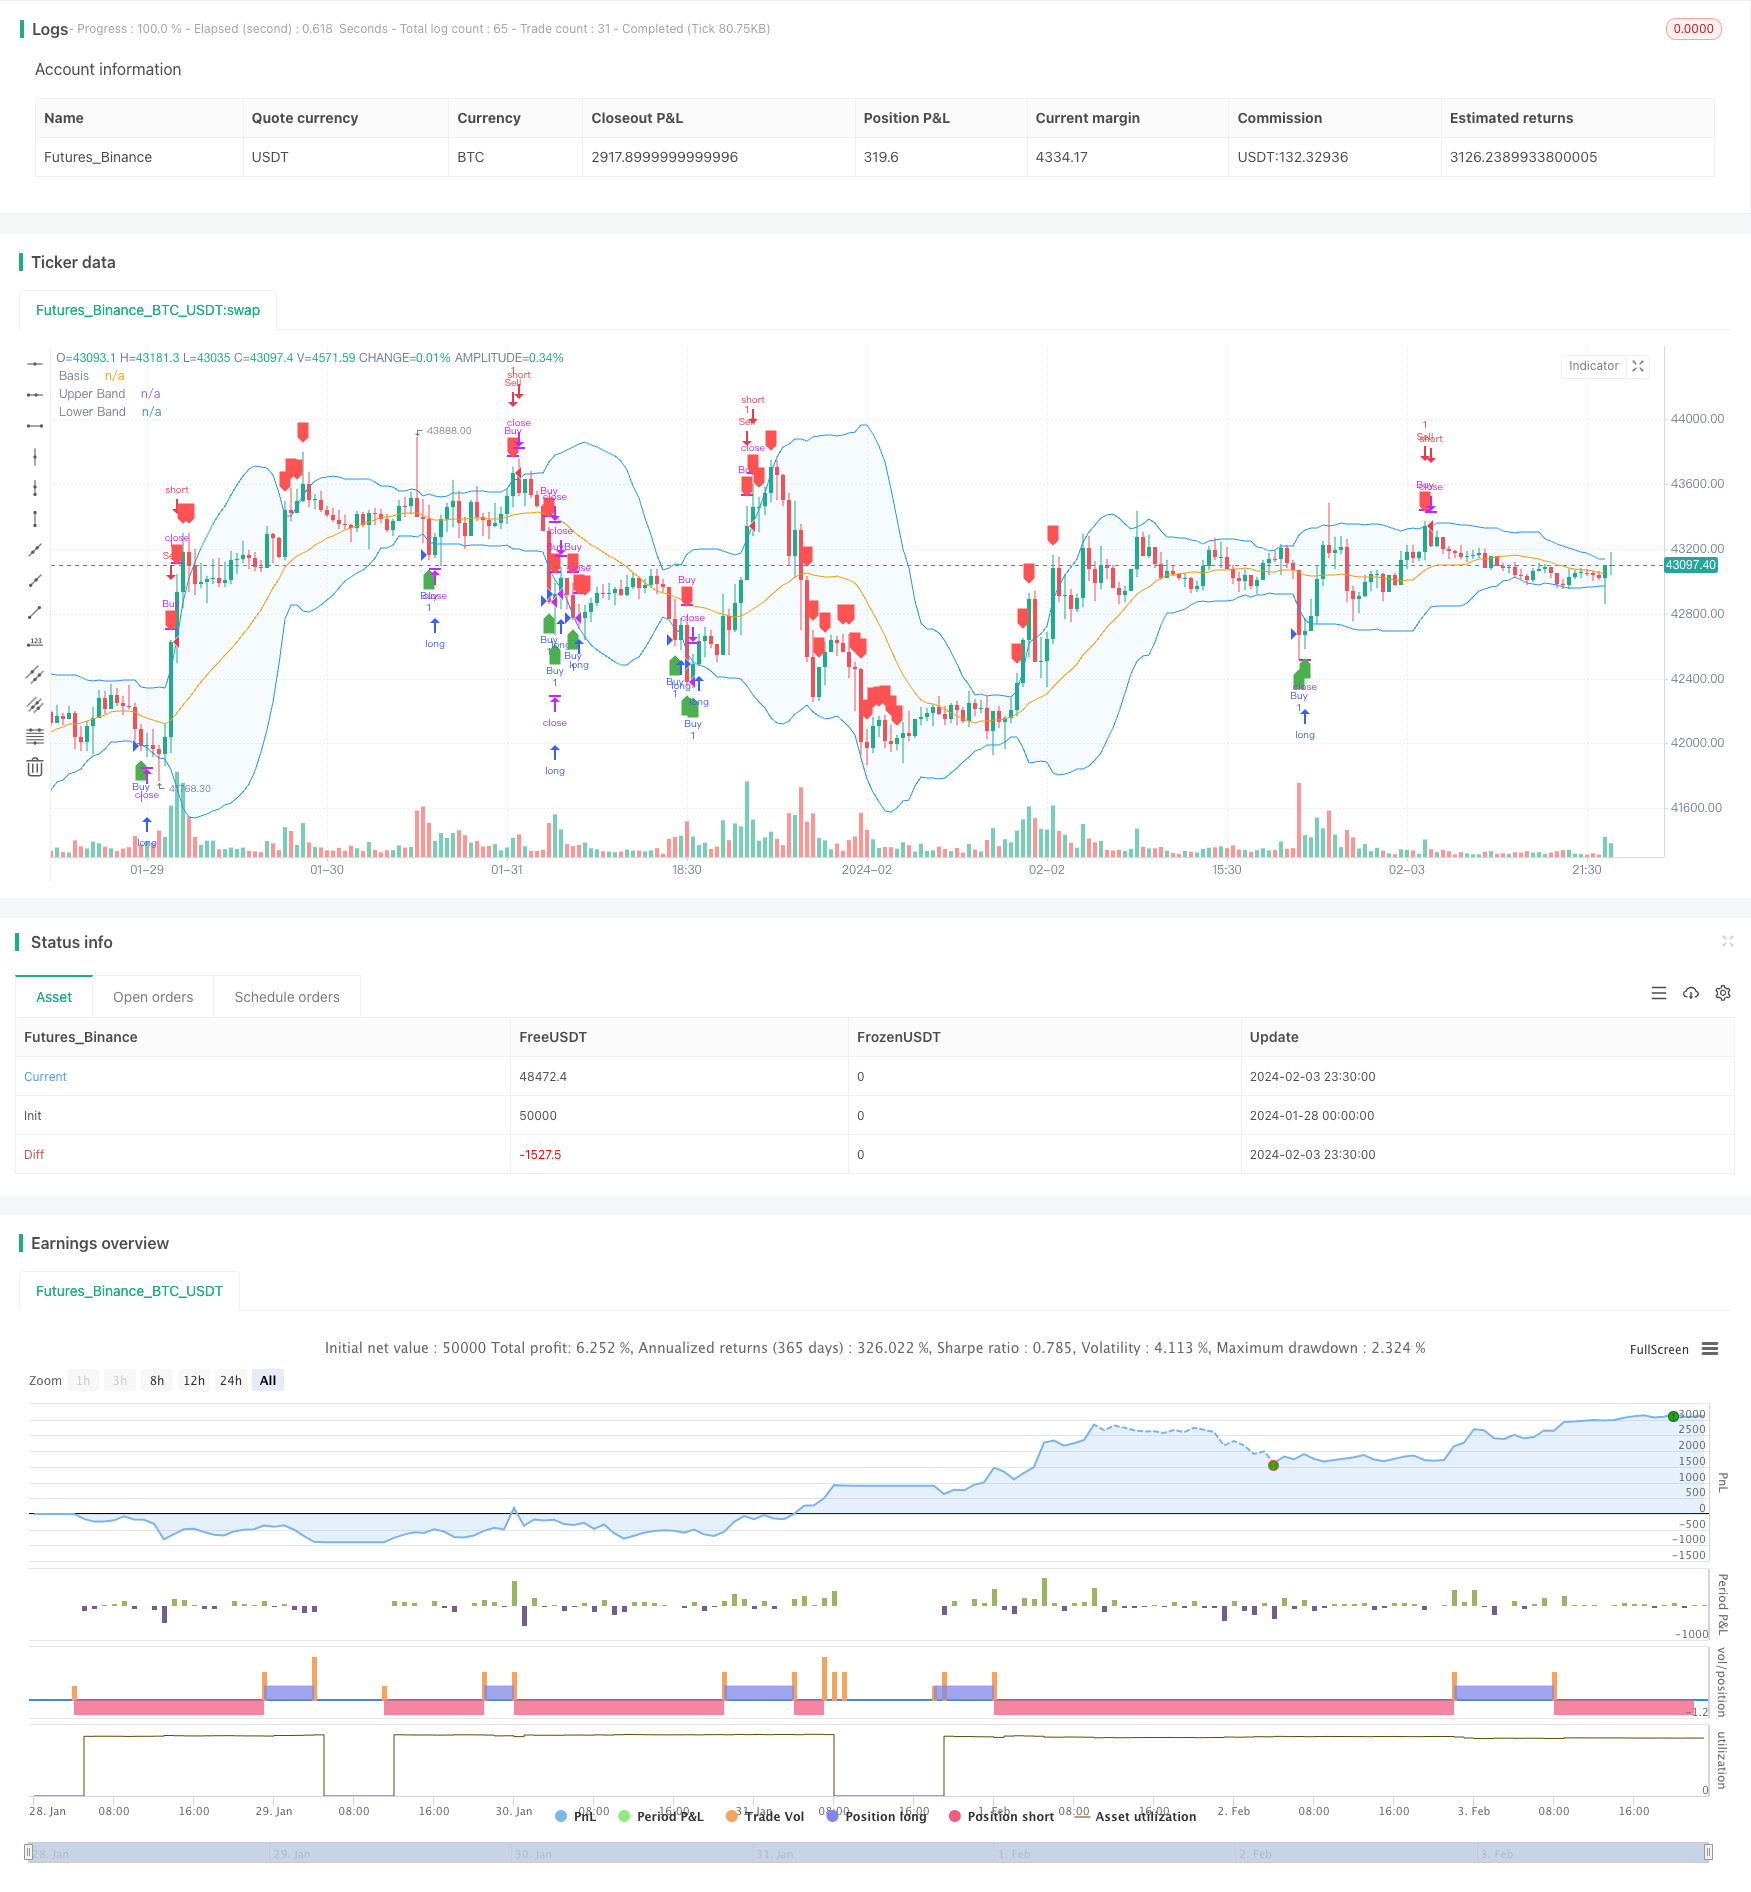
该策略是基于布林带的双轨道突破交易策略。它使用布林带的上轨和下轨作为买入和卖出信号,并设定了止损点以控制风险。
该策略使用布林带的上轨和下轨线。布林带是由均线及其对应的两个标准差通道组成。当价格接触或突破布林带上轨时产生卖出信号;当价格接触或突破布林带下轨时产生买入信号。 此外,该策略还设置了止损点。当价格低于均线一定比例时,会识别止损。
具体来说,策略通过计算指定周期(如20日)的平均线及其标准差的两倍来绘制布林带。上轨线为平均线加上标准差的两倍,下轨线为平均线减去标准差的两倍。当收盘价大于或等于上轨线时,发出卖出信号;当收盘价小于或等于下轨线时,发出买入信号。此外,如果价格低于平均线的一定比例(如1%),则发出止损信号。
该策略利用布林带的特性,在价格出现异常波动时能够发出交易信号,从而抓住价格反转的机会。相比单纯跟踪均线策略,该策略能够在波动加大时产生交易信号,在一定程度上规避了假突破的风险。
与简单的双轨道突破策略相比,该策略增加了止损机制。这能够有效控制个别错误信号造成的损失。止损点的设置也比较合理,距离平均线较近,避免了过于激进的止损造成的过多损失。
该策略最大的风险在于布林带本身并不能确保交易信号的有效性。当市场出现特殊情况时,价格可能出现不合理的大幅波动,这时布林带发出的交易信号可能是错误的。此时很可能造成较大的亏损。
另外,止损点的设置也可能过于激进或保守,这都会影响最终的收益。如果止损幅度过大,则有效信号可能会被频繁止损;而如果止损幅度过小,则无法有效控制损失。
该策略可以从以下几个方面进行优化:
-
测试不同的参数组合,如均线周期、标准差倍数、止损百分比等的不同数值,寻找最优参数;
-
增加其他指标判断,形成多重过滤条件,避免错误信号;
-
优化止损策略,如采用移动止损、分批止损等方式替代简单的止损;
-
结合不同时间周期的布林带进行交易信号确认,避免被套。
该策略整体来说是一种实用的趋势跟踪和双轨突破结合的策略。它能够在价格波动加大时抓住反转机会,并设置了止损来控制风险。通过参数优化、增加信号过滤以及优化止损策略等手段,可以进一步增强该策略的稳定性和盈利能力。
||
This strategy is a dual-track breakthrough trading strategy based on Bollinger Bands. It uses the upper and lower rails of Bollinger Bands as buy and sell signals, and sets a stop loss point to control risks.
The strategy uses the upper and lower rails of the Bollinger Bands. Bollinger Bands consist of a moving average and two standard deviation channels corresponding to it. A sell signal is generated when the price touches or breaks through the upper rail of the Bollinger Bands; A buy signal is generated when the price touches or breaks through the lower rail of the Bollinger Bands. In addition, the strategy also sets a stop loss point. When the price is lower than a certain percentage of the moving average, a stop loss will be identified.
Specifically, the strategy calculates the moving average and twice the standard deviation of the specified cycle (such as 20 days) to plot the Bollinger Bands. The upper rail is the moving average plus twice the standard deviation, and the lower rail is the moving average minus twice the standard deviation. When the closing price is greater than or equal to the upper rail, a sell signal is issued; when the closing price is less than or equal to the lower rail, a buy signal is issued. In addition, if the price is lower than a certain percentage (such as 1%) of the moving average, a stop loss signal is issued.
The strategy utilizes the characteristics of Bollinger Bands to issue trading signals when abnormal price fluctuations occur, thus capturing opportunities for price reversals. Compared with simple moving average tracking strategies, this strategy can generate trading signals when volatility increases, avoiding the risk of false breakouts to some extent.
Compared with simple dual-track breakthrough strategies, this strategy adds a stop-loss mechanism. This can effectively control the loss caused by individual wrong signals. The setting of the stop loss point is also relatively reasonable, close to the moving average, avoiding excessive stop loss causing too much loss.
The biggest risk of this strategy is that Bollinger Bands itself cannot guarantee the validity of trading signals. When special situations occur in the market, prices may fluctuate sharply and abnormally, in which case the trading signals issued by Bollinger Bands may be wrong. This is likely to cause considerable losses.
In addition, the setting of stop loss points may also be too aggressive or conservative, which will affect the final income. If the stop loss range is too large, valid signals may be stopped loss frequently; if the stop loss range is too small, it cannot effectively control the loss.
The strategy can be optimized in the following aspects:
-
Test different parameter combinations, such as different values of moving average cycle, standard deviation multiplier, stop loss percentage, etc., to find the optimal parameters;
-
Increase other indicators to judge and form multiple filter conditions to avoid wrong signals;
-
Optimize stop loss strategies, such as using moving stop loss, batch stop loss instead of simple stop loss;
-
Confirm trading signals by combining Bollinger Bands of different time cycles to avoid being trapped.
Overall, this strategy is a practical combination of trend tracking and dual-track breakthrough strategies. It can seize opportunities for reversals when price fluctuations increase, and sets stop losses to control risks. By means of parameter optimization, increased signal filtering, optimized stop loss strategies, etc., the stability and profitability of the strategy can be further enhanced.
[/trans]
Strategy Arguments
| Argument | Default | Description |
|---|---|---|
| v_input_int_1 | 20 | length |
| v_input_string_1 | 0 | Basis MA Type: SMA |
| v_input_1_close | 0 | Source: close |
| v_input_float_1 | 2 | StdDev |
| v_input_float_2 | true | Stop Loss Percent |
Source (PineScript)
/*backtest
start: 2024-01-28 00:00:00
end: 2024-02-04 00:00:00
period: 30m
basePeriod: 15m
exchanges: [{"eid":"Futures_Binance","currency":"BTC_USDT"}]
*/

//@version=5
strategy("Bollinger Bands Strategy by Royce Mars", overlay=true)

length = input.int(20, minval=1)
maType = input.string("SMA", "Basis MA Type", options = ["SMA", "EMA", "SMMA (RMA)", "WMA", "VWMA"])
src = input(close, title="Source")
mult = input.float(2.0, minval=0.001, maxval=50, title="StdDev")
stopLossPercent = input.float(1.0, title="Stop Loss Percent", minval=0.1, maxval=10, step=0.1)

ma(source, length, _type) =>
    switch _type
        "SMA" => ta.sma(source, length)
        "EMA" => ta.ema(source, length)
        "SMMA (RMA)" => ta.rma(source, length)
        "WMA" => ta.wma(source, length)
        "VWMA" => ta.vwma(source, length)

basis = ma(src, length, maType)
dev = mult * ta.stdev(src, length)
upper = basis + dev
lower = basis - dev

// Buy and Sell Conditions
buyCondition = close <= lower
sellCondition = close >= upper

// Stop Loss Condition
stopLossCondition = close < basis * (1 - stopLossPercent / 100)

// Strategy Execution
strategy.entry("Buy", strategy.long, when=buyCondition)
strategy.close("Buy", when=sellCondition or stopLossCondition)

strategy.entry("Sell", strategy.short, when=sellCondition)
strategy.close("Sell", when=buyCondition)

// Plotting on the Chart
plotshape(buyCondition, title="Buy Signal", color=color.green, style=shape.labelup, location=location.belowbar)
plotshape(sellCondition or stopLossCondition, title="Sell Signal", color=color.red, style=shape.labeldown, location=location.abovebar)

// Plotting the Bollinger Bands
plot(basis, "Basis", color=color.orange)
p1 = plot(upper, "Upper Band", color=color.blue)
p2 = plot(lower, "Lower Band", color=color.blue)
fill(p1, p2, title="Background", color=color.rgb(33, 150, 243, 95))
Detail
https://www.fmz.com/strategy/441078
Last Modified
2024-02-05 14:05:47
