Name
基于布林带和MACD的量化交易策略Trading-Strategy-Based-on-Bollinger-Bands-and-MACD
Author
ChaoZhang
Strategy Description
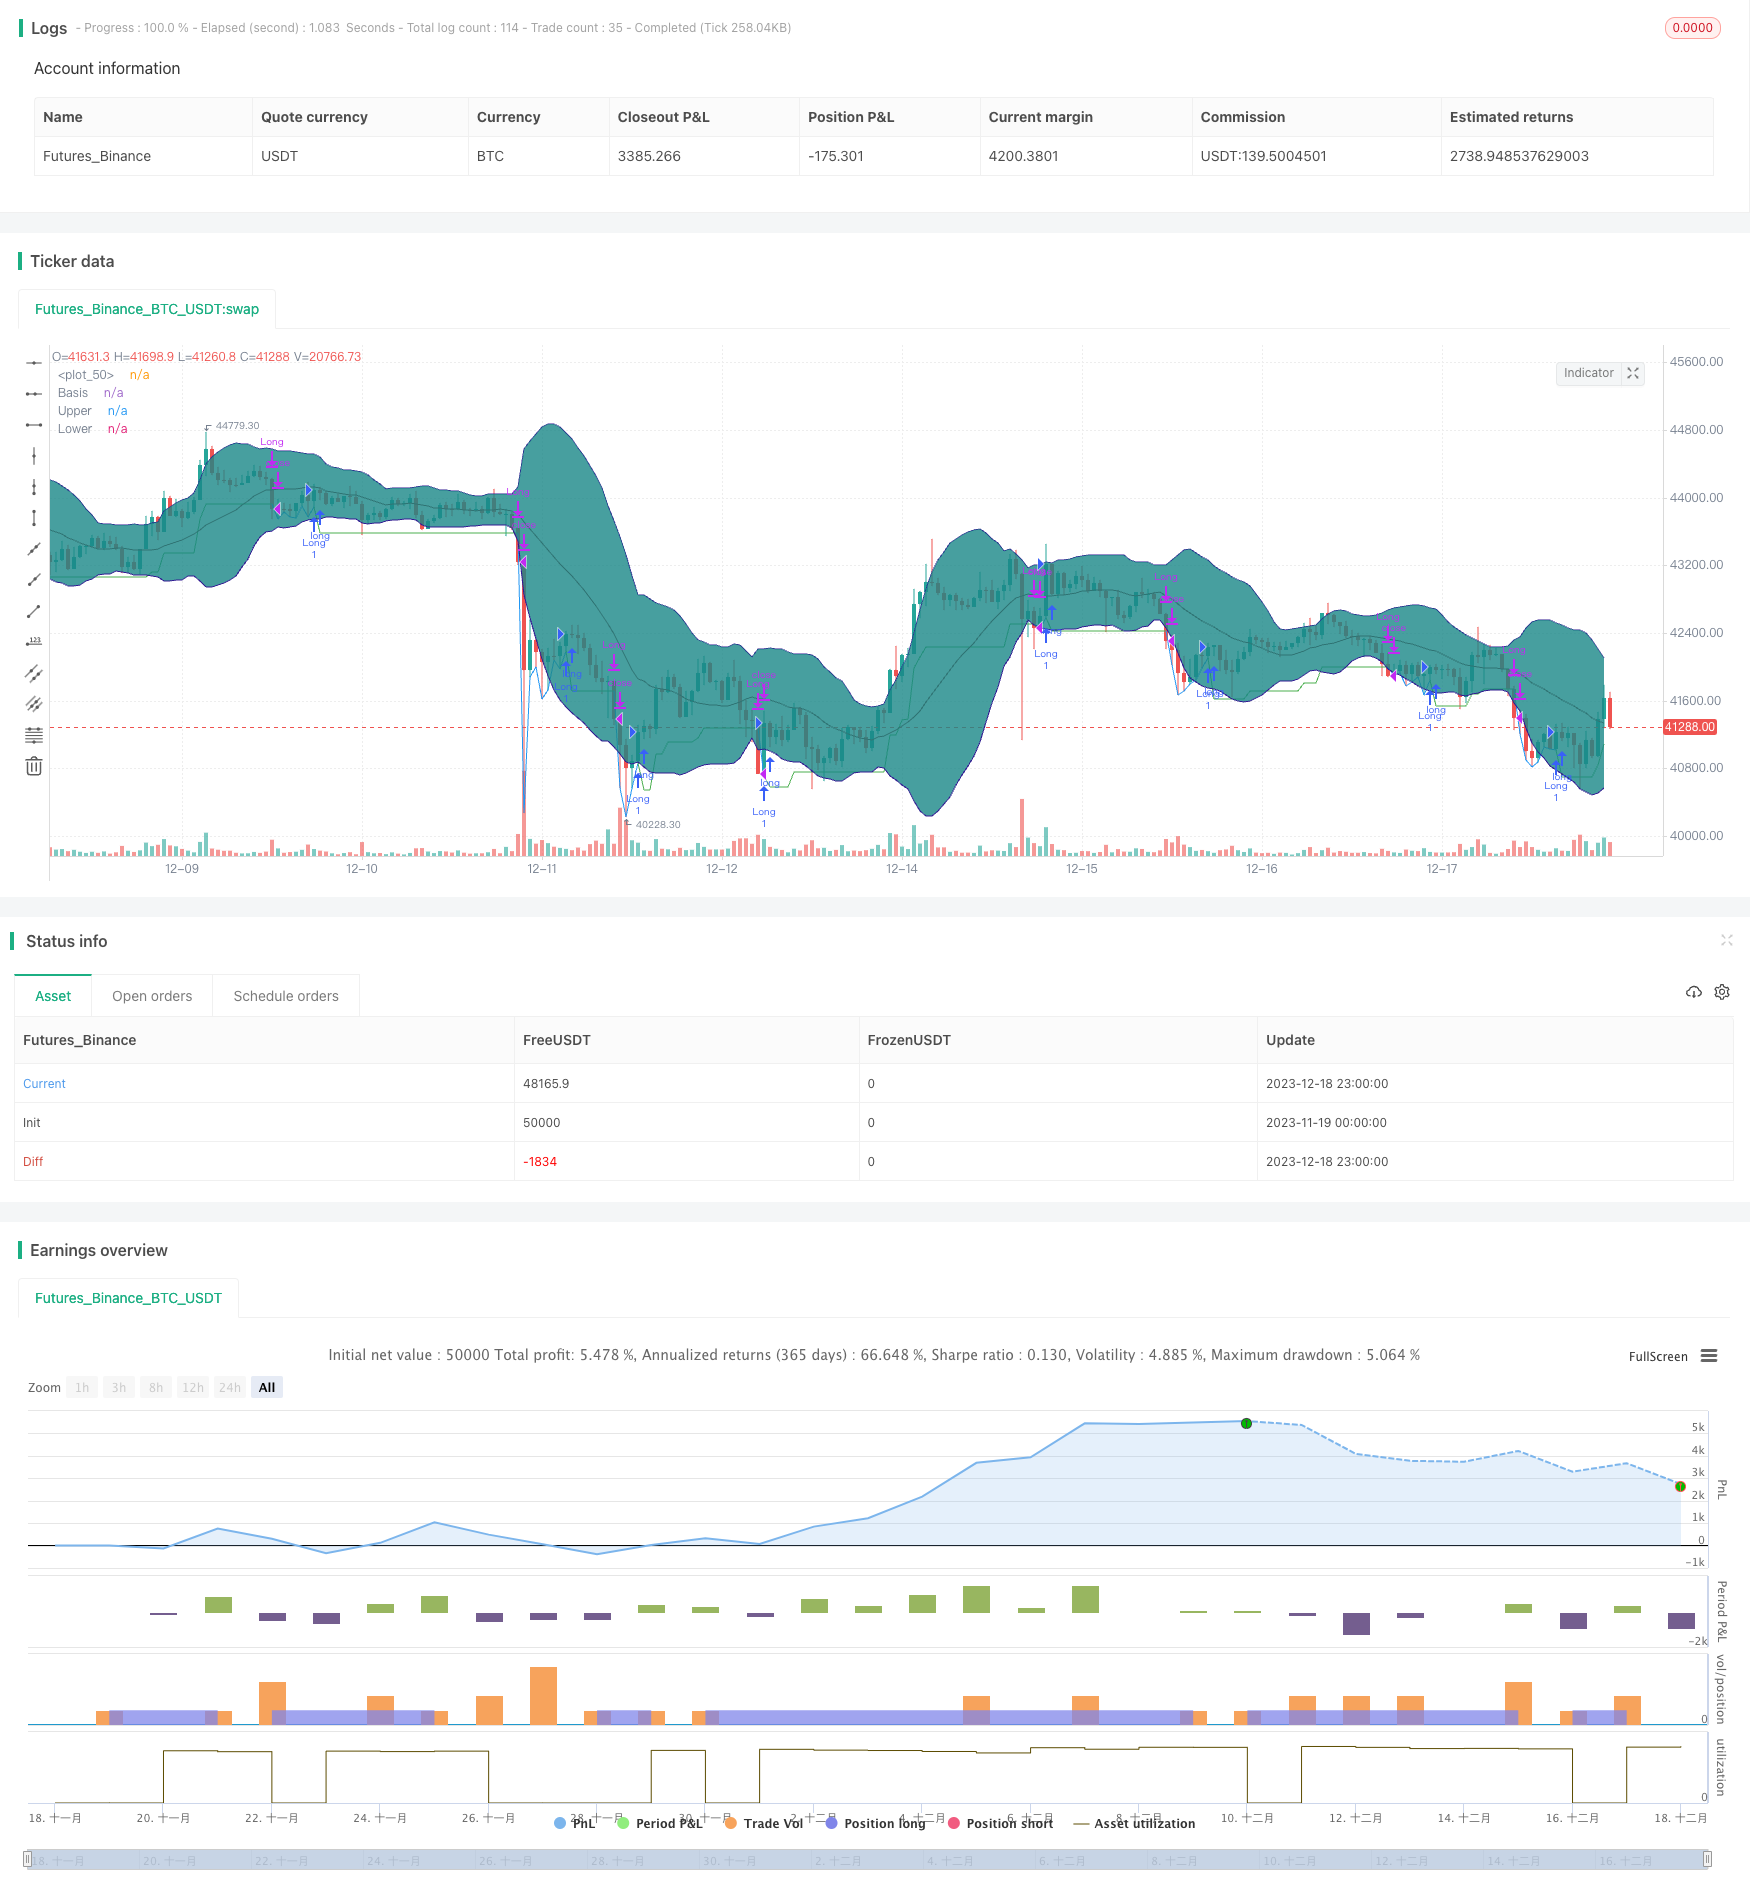
该策略结合了布林带和MACD指标,利用布林带判断市场超卖机会以及MACD指标判断趋势反转,实现低买高卖的量化交易策略。策略名称定为“布林MACD反转策略”。
该策略首先计算20日布林带,包括中轨、上轨和下轨。当价格触碰下轨时,认为市场处于超卖状态。此时结合MACD指标判断趋势是否反转,如果差值MACD向上突破信号线,则判断为本轮跌势结束,对应的就是买入信号。
具体来说,布林带下轨触碰和差值MACD正向突破信号线同时触发时产生买入信号;收盘价格上涨超过止损位时产生止盈信号。
该策略整合布林带判断超卖区和MACD判断趋势反转信号,实现了较低的买入价格。同时,策略加入了止盈方式,能够锁定收益,避免亏损。
具体来说,优势有:
- 结合布林带超卖区和MACD指标,实现较优买入点
- 利用MACD指标判断趋势反转点,减少假突破概率
- 采用止损止盈方式,能够有效控制风险
该策略也存在一定的风险,主要集中在以下几个方面:
- 布林带被突破的概率存在,可能导致超卖区判断失效
- MACD差值突破也可能是假突破,判断失误概率存在
- 止损位置设置不合理,可能过于宽松或严格,导致防守不足或止损过急
针对以上风险,可采取如下措施防范:
- 结合其它指标验证布林带突破信号的有效性
- 增加量能指标等过滤器,避免MACD假突破
- 优化和测试不同的参数止损方案
该策略还存在进一步优化的空间,主要包括:
- 优化布林带参数,寻找更优超卖区判断方案
- 增加量能指标等过滤器,提高MACD判断有效性
- 测试ATR等指标的止损方式,寻找更优参数
- 增加趋势判断模块,避免逆势交易
- 结合机器学习方法训练判断模型,提高策略整体效果
该策略整合布林带超卖区判断和MACD趋势反转指标,实现了相对较优的买入点选择。同时,设置了止损止盈方式控制风险。这是一个值得借鉴和优化的低买高卖策略。结合更多指标过滤和机器学习方法,该策略效果还有进一步提升的空间。
||
This strategy combines Bollinger Bands and MACD indicator to identify oversold opportunities and trend reversals for quantitative trading. The strategy name is "Bollinger MACD Reversal Strategy".
The strategy first calculates 20-day Bollinger Bands, including middle band, upper band and lower band. When price touches the lower band, it considers the market oversold. At this point, combine with MACD indicator to judge whether the trend is reversing. If MACD histogram crosses above signal line positively, it determines the end of this round of decline, which corresponds to the buy signal.
Specifically, touching the Bollinger lower band and MACD histogram crossing signal line positively triggers the buy signal simultaneously. When close price rises above the stop loss level, it triggers the take profit signal.
The strategy integrates Bollinger Bands to judge oversold zone and MACD to determine trend reversal signals, realizing relatively lower entry price. It also includes take profit methods to lock in profits and avoid losses.
In particular, the advantages are:
- Combining Bollinger Bands oversold zone and MACD indicator to achieve better entry points
- Using MACD indicator to determine trend reversal points, reducing false breakout probabilities
- Adopting stop loss/take profit methods to effectively control risks
There are still some risks mainly in the following aspects:
- Probability of Bollinger Bands breakout exists, which may cause failure in oversold zone judgement
- MACD histogram crossover could also be false one with judgement error probability
- Stop loss position setting may be improper, either too loose or strict, leading to insufficient defence or premature stop loss
To hedge against the above risks, we can take the following measures:
- Combine with other indicators to verify validity of Bollinger Bands breakout signals
- Add momentum indicators etc. as filters to avoid MACD false crossover
- Optimize and test different stop loss parameters
There is still room for further optimization, mainly including:
- Optimize Bollinger Bands parameters to find better oversold judgement schemes
- Add momentum indicators filters to improve MACD judgement validity
- Test stop loss methods like ATR to find better parameters
- Add trend judgement module to avoid counter trend trading
- Combine machine learning methods to train judgement models and improve overall strategy performance
The strategy integrates Bollinger Bands oversold zone judgement and MACD trend reversal indicator to achieve relatively better entry points. It also sets up stop loss/take profit methods to control risks. This is a worthwhile low buy high sell strategy to reference and optimize. Combined with more indicator filters and machine learning methods, there is still space to further improve its performance.
[/trans]
Strategy Arguments
| Argument | Default | Description |
|---|---|---|
| v_input_1 | timestamp(01 Nov 2010 13:30 +0000) | Backtest Start Time |
| v_input_2 | false | Exit when Risk:Reward met |
| v_input_3 | 3 | Risk:[Reward] (i.e. 3) for exit |
| v_input_4 | 2 | ATR multiplier for stop loss |
Source (PineScript)
/*backtest
start: 2023-11-19 00:00:00
end: 2023-12-19 00:00:00
period: 1h
basePeriod: 15m
exchanges: [{"eid":"Futures_Binance","currency":"BTC_USDT"}]
*/

// This source code is subject to the terms of the Mozilla Public License 2.0 at https://mozilla.org/MPL/2.0/
// © DojiEmoji

//@version=4
strategy("[KL] BOLL + MACD Strategy v2 (published)",overlay=true)

// BOLL bands {
BOLL_length = 20
BOLL_src = close
BOLL_mult = 2.0
BOLL_basis = sma(BOLL_src, BOLL_length)
BOLL_dev = BOLL_mult * stdev(BOLL_src, BOLL_length)
BOLL_upper = BOLL_basis + BOLL_dev
BOLL_lower = BOLL_basis - BOLL_dev
BOLL_offset = 0
plot(BOLL_basis, "Basis", color=#872323, offset = BOLL_offset)
BOLL_p1 = plot(BOLL_upper, "Upper", color=color.navy, offset = BOLL_offset, transp=50)
BOLL_p2 = plot(BOLL_lower, "Lower", color=color.navy, offset = BOLL_offset, transp=50)
fill(BOLL_p1, BOLL_p2, title = "Background", color=#198787, transp=85)
// }
// MACD signals {
MACD_fastLen = 12
MACD_slowLen = 26
MACD_Len = 9
MACD = ema(close, MACD_fastLen) - ema(close, MACD_slowLen)
aMACD = ema(MACD, MACD_Len)
MACD_delta = MACD - aMACD
// }
backtest_timeframe_start = input(defval = timestamp("01 Nov 2010 13:30 +0000"), title = "Backtest Start Time", type = input.time)
//backtest_timeframe_end = input(defval = timestamp("05 Mar 2021 19:30 +0000"), title = "Backtest End Time", type = input.time)
TARGET_PROFIT_MODE = input(false,title="Exit when Risk:Reward met")
REWARD_RATIO = input(3,title="Risk:[Reward] (i.e. 3) for exit")
// Trailing stop loss {
var entry_price = float(0)
ATR_multi_len = 26
ATR_multi = input(2, "ATR multiplier for stop loss")
ATR_buffer = atr(ATR_multi_len) * ATR_multi
risk_reward_buffer = (atr(ATR_multi_len) * ATR_multi) * REWARD_RATIO
take_profit_long = low > entry_price + risk_reward_buffer
take_profit_short = low < entry_price - risk_reward_buffer
var bar_count = 0 //number of bars since entry
var trailing_SL_buffer = float(0)
var stop_loss_price = float(0)
stop_loss_price := max(stop_loss_price, close - trailing_SL_buffer)
// plot TSL line
trail_profit_line_color = color.green
if strategy.position_size == 0
    trail_profit_line_color := color.blue
    stop_loss_price := low
plot(stop_loss_price,color=trail_profit_line_color)
// }

var touched_lower_bb = false

if true// and time <= backtest_timeframe_end
    if low <= BOLL_lower
        touched_lower_bb := true
    else if strategy.position_size > 0
        touched_lower_bb := false//reset state
    expected_rebound = MACD > MACD[1] and abs(MACD - aMACD) < abs(MACD[1] - aMACD[1])
    buy_condition = touched_lower_bb and MACD > aMACD or expected_rebound

    //ENTRY:
    if strategy.position_size == 0 and buy_condition
        entry_price := close
        trailing_SL_buffer := ATR_buffer
        stop_loss_price := close - ATR_buffer
        strategy.entry("Long",strategy.long, comment="buy")
        bar_count := 0
    else if strategy.position_size > 0
        bar_count := bar_count + 1

    //EXIT:
    // Case (A) hits trailing stop
    if strategy.position_size > 0 and close <= stop_loss_price
        if close > entry_price
            strategy.close("Long", comment="take profit [trailing]")
            stop_loss_price := 0
        else if close <= entry_price and bar_count
            strategy.close("Long", comment="stop loss")
            stop_loss_price := 0
        bar_count := 0
    // Case (B) take targeted profit relative to risk
    if strategy.position_size > 0 and TARGET_PROFIT_MODE
        if take_profit_long
            strategy.close("Long", comment="take profits [risk:reward]")
            stop_loss_price := 0
        bar_count := 0
Detail
https://www.fmz.com/strategy/435984
Last Modified
2023-12-20 15:55:18
