Name
基于布林带和交易量的双重确认量化交易策略Bollinger-Bands-Volume-Confirmation-Quantitative-Trading-Strategy
Author
ChaoZhang
Strategy Description
本策略名为“Bollinger Bands Volume Confirmation策略”,其核心思想是将布林带指标和交易量指标相结合,实现价格行情和交易量的双重确认,从而产生更加可靠的买入和卖出信号。
该策略主要包含两部分:
-
布林带指标部分。该部分计算一定周期(如20日)的收盘价的简单移动平均线,并计算这些收盘价相对其移动平均线的标准差。然后根据标准差的数值,计算出对应移动平均线上下各一个标准差范围的带状区域,称为布林带。布林带的带状区域能清晰地显示当前价格是否处在“异常状态”。
-
交易量部分。该部分计算同样周期内(如20日)的交易量的移动平均值,然后利用一个乘数(如2.0)设置交易量阈值。只有当交易量超过该阈值时,才看作有效的“大量”交易量出现。
当价格上穿上轨布林带,并且交易量超过交易量阈值时,产生买入信号;当价格下穿下轨布林带,并且交易量超过交易量阈值时,产生卖出信号。
通过价格和交易量的双重确认,可以过滤掉一些假信号,使交易策略更加可靠。
-
双重确认机制,避免假突破,过滤噪音。将价格和交易量指标相结合,只在两者同时确认的情况下才产生信号,可以有效避免一些因为空头情况下的价格突破造成的错误信号。
-
参数可调性强。用户可以自行设置布林带的周期参数及交易量阈值的倍数参数,从而适应不同市场环境。
-
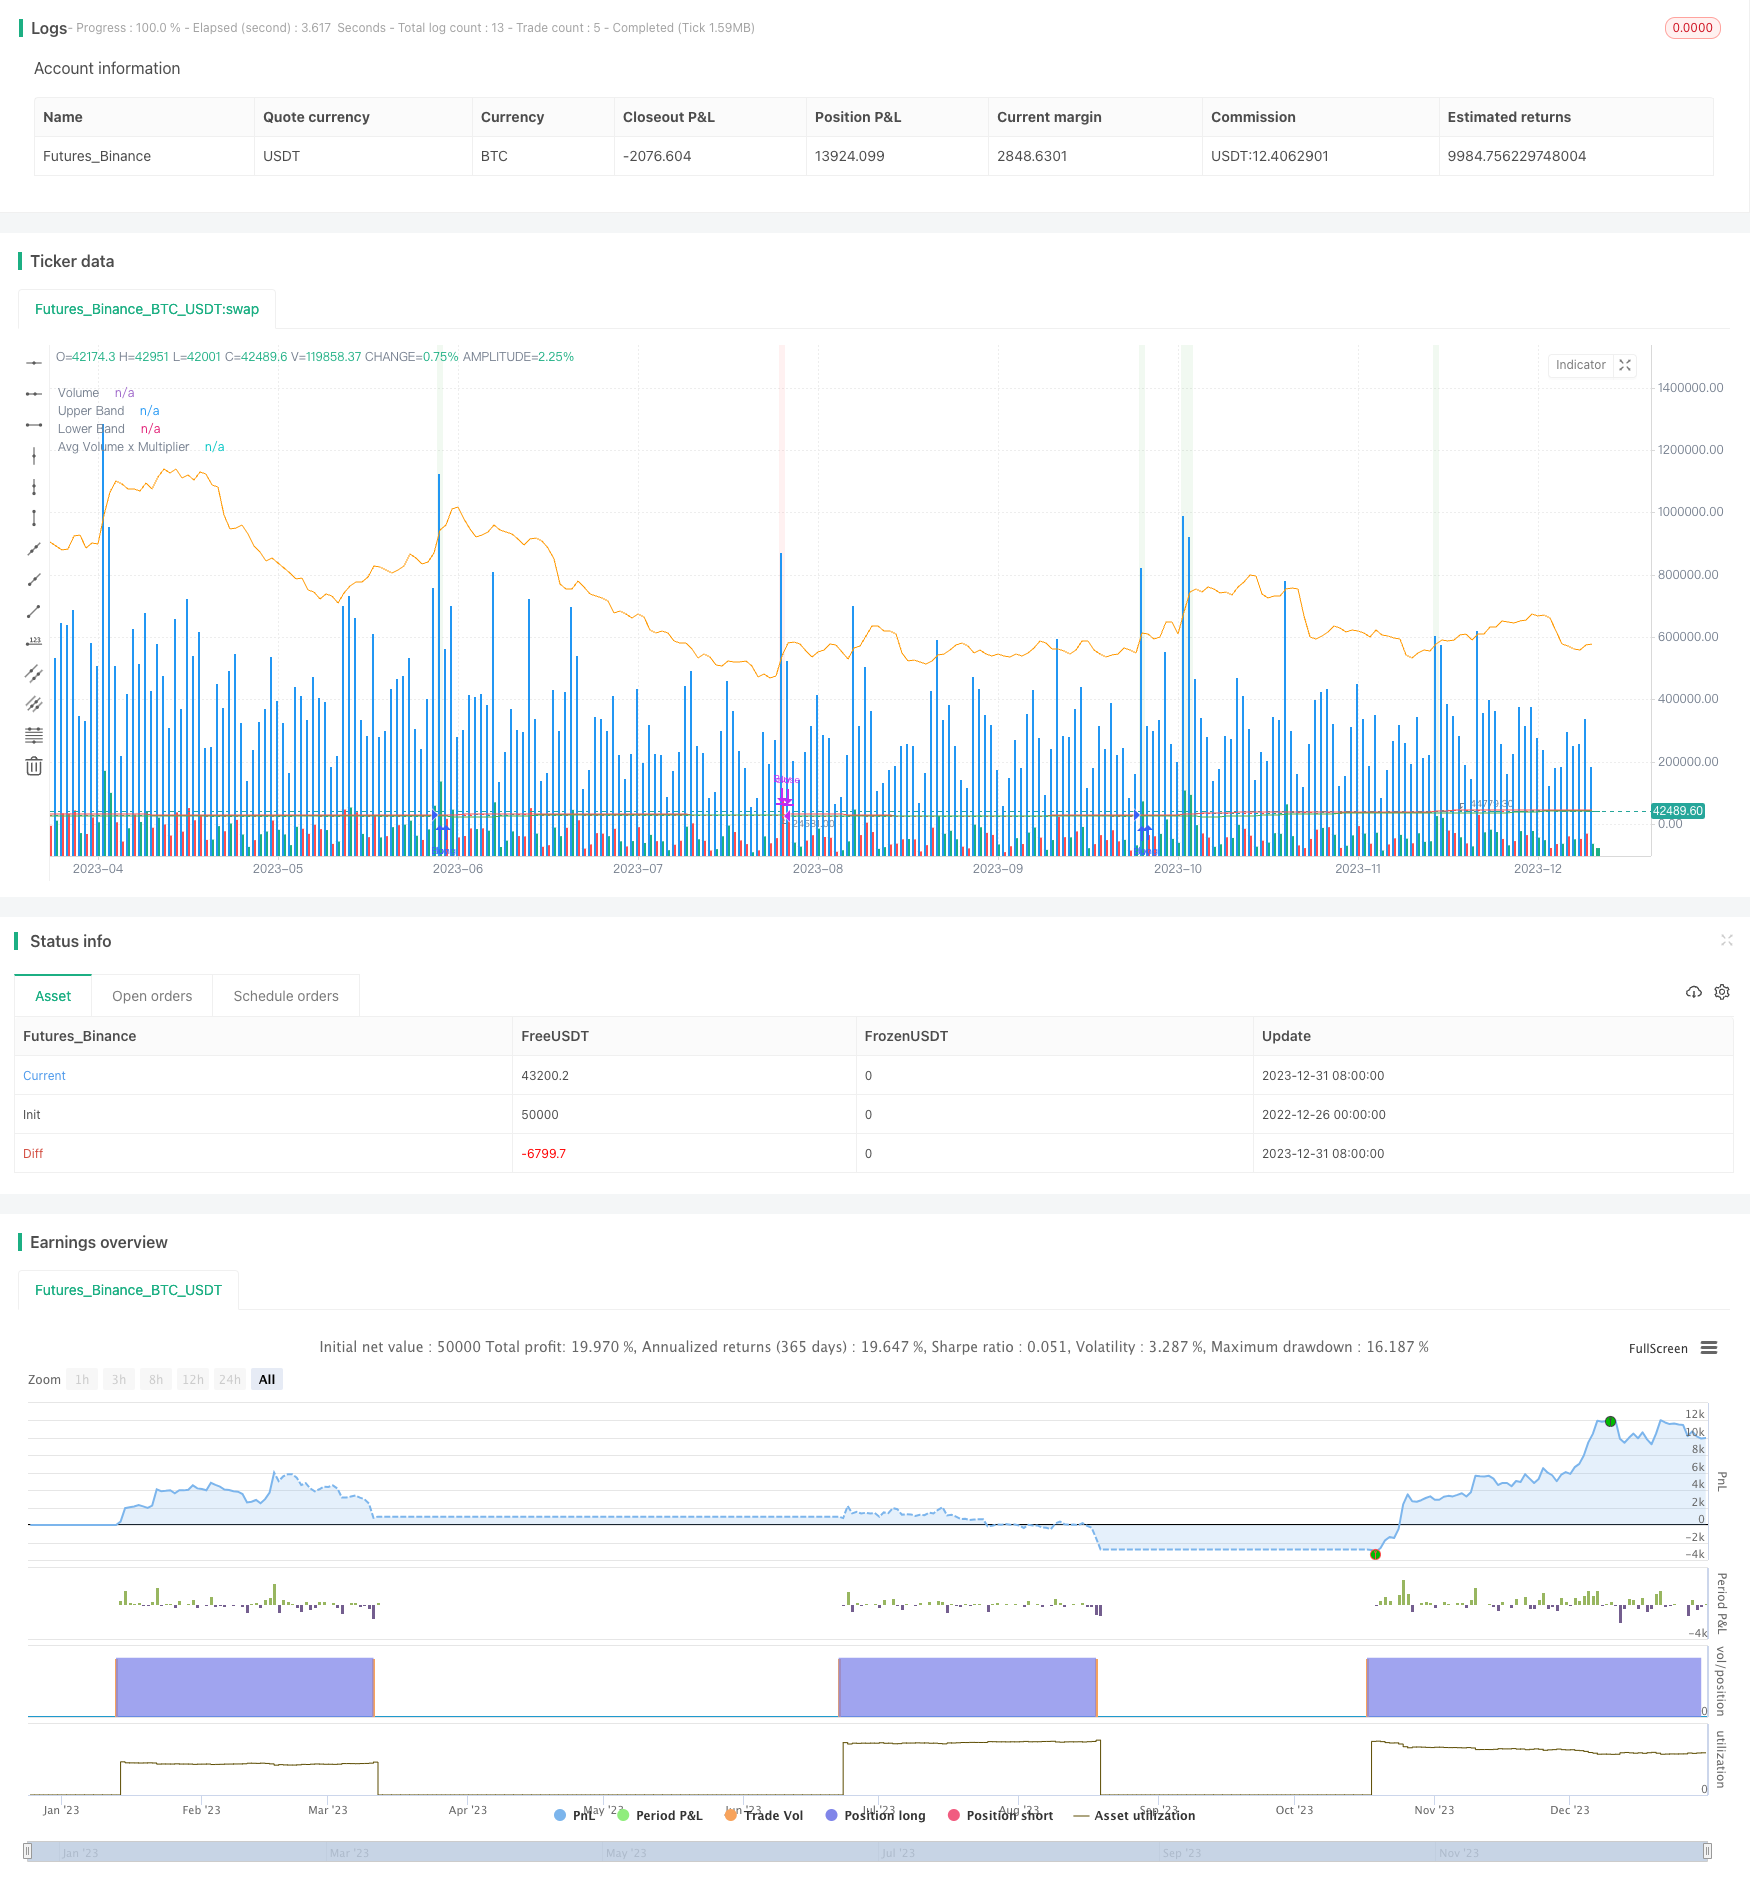
直观的示意图。上下轨布林带、交易量及交易量阈值的可视化指标,使策略信号更加直观清晰。
-
布林带本身并不能完美识别趋势反转点。布林带仅能清晰地显示价格的“异常状态”,但无法预测价格反转。因此仍需要结合其他指标进行判断。
-
交易量信号可能滞后。当快速突破上下轨布林带时,交易量的反应可能会有一定滞后,导致信号产生也滞后,无法完美捕捉转折点。
-
可尝试结合其他指标。如KDJ、MACD等指标,引入更多变量,建立更复杂的多元交易策略,从而提高策略的实用性。
本策略通过双重确认和参数调节的方法,在一定程度上过滤了过多的噪音,使交易决策更加可靠。但仍需警惕布林带本身的局限性,后期可尝试引入其他指标进行优化,建立多元化量化策略。
||
This strategy is called “Bollinger Bands Volume Confirmation Strategy”. Its core idea is to combine the Bollinger Bands indicator and volume indicator to achieve double confirmation of price movement and trading volume, thereby generating more reliable buy and sell signals.
The strategy mainly includes two parts:
-
Bollinger Bands part. This part calculates the simple moving average of closing prices over a certain period (such as 20 days) and calculates the standard deviation of these closing prices relative to their moving average. Then, according to the value of the standard deviation, two bands are calculated at a standard deviation range above and below the moving average, which is called Bollinger Bands. The band area of Bollinger Bands can clearly show whether the current price is in an "abnormal state".
-
Volume part. This part calculates the moving average value of trading volume over the same period (such as 20 days), and then uses a multiplier (such as 2.0) to set a trading volume threshold. Only when the trading volume exceeds this threshold is it regarded as a valid "large" trading volume.
When the price breaks through the upper track of Bollinger Bands and the trading volume exceeds the trading volume threshold, a buy signal is generated; when the price breaks through the lower track of Bollinger Bands, and the trading volume exceeds the trading volume threshold, a sell signal is generated.
By the double confirmation of price and trading volume, some false signals can be filtered out, making the trading strategy more reliable.
-
Double confirmation mechanism to avoid false breakouts and filter noise. Combining price and volume indicators, signals are generated only when both confirm at the same time, which can effectively avoid some erroneous signals caused by empty price breakouts.
-
Adjustable parameters. Users can set the period parameters of Bollinger Bands and the multiplier parameters of the trading volume threshold independently to adapt to different market environments.
-
Intuitive illustration. The upper and lower Bollinger Bands, trading volume, and trading volume threshold indicators enable more intuitive and clear strategy signals.
-
Bollinger Bands itself cannot perfectly identify trend reversal points. Bollinger Bands can only clearly show the "abnormal state" of prices but cannot predict price reversals. Therefore, it still needs to be combined with other indicators for judgment.
-
Volume signals may lag. When there is a rapid breakout of the upper and lower Bollinger Bands, the reaction of the trading volume may lag, resulting in a lag in signal generation and inability to perfectly capture turning points.
-
Try to combine other indicators. Indicators such as KDJ, MACD, etc., introduce more variables to establish more complex multivariate trading strategies, thereby improving the practicality of the strategy.
By using the method of double confirmation and parameter adjustment, this strategy has filtered out too much noise to some extent, making trading decisions more reliable. But the limitations of Bollinger Bands itself still need to be guarded against. In the future, other indicators can be introduced to optimize and establish diversified quantitative strategies. [/trans]
Strategy Arguments
| Argument | Default | Description |
|---|---|---|
| v_input_1 | 20 | BB Length |
| v_input_2 | 2 | Multiplier |
| v_input_3 | 2 | Volume Multiplier |
Source (PineScript)
/*backtest
start: 2022-12-26 00:00:00
end: 2024-01-01 00:00:00
period: 1d
basePeriod: 1h
exchanges: [{"eid":"Futures_Binance","currency":"BTC_USDT"}]
*/

//@version=5
strategy("Volume + Bollinger Bands Strategy", overlay = true, shorttitle="Vol BB Strategy")

// Bollinger Bands Parameters
length = input(20, title="BB Length")
src = close
mult = input(2.0, title="Multiplier")
basis = ta.sma(src, length)
upper = basis + mult * ta.stdev(src, length)
lower = basis - mult * ta.stdev(src, length)

// Volume Parameters
volMultiplier = input(2.0, title="Volume Multiplier")
avgVolume = ta.sma(volume, length)

// Strategy Logic
buyCondition = close > upper and volume > volMultiplier * avgVolume
sellCondition = close < lower and volume > volMultiplier * avgVolume

// Plotting
plot(upper, color=color.red, title="Upper Band")
plot(lower, color=color.green, title="Lower Band")
plot(volume, color=color.blue, style=plot.style_columns, title="Volume", transp=85)
plot(avgVolume * volMultiplier, color=color.orange, title="Avg Volume x Multiplier")

// Strategy Execution
strategy.entry("Buy", strategy.long, when=buyCondition)
strategy.close("Buy", when=sellCondition)

bgcolor(buyCondition ? color.new(color.green, 90) : sellCondition ? color.new(color.red, 90) : na)
Detail
https://www.fmz.com/strategy/437386
Last Modified
2024-01-02 11:04:35
