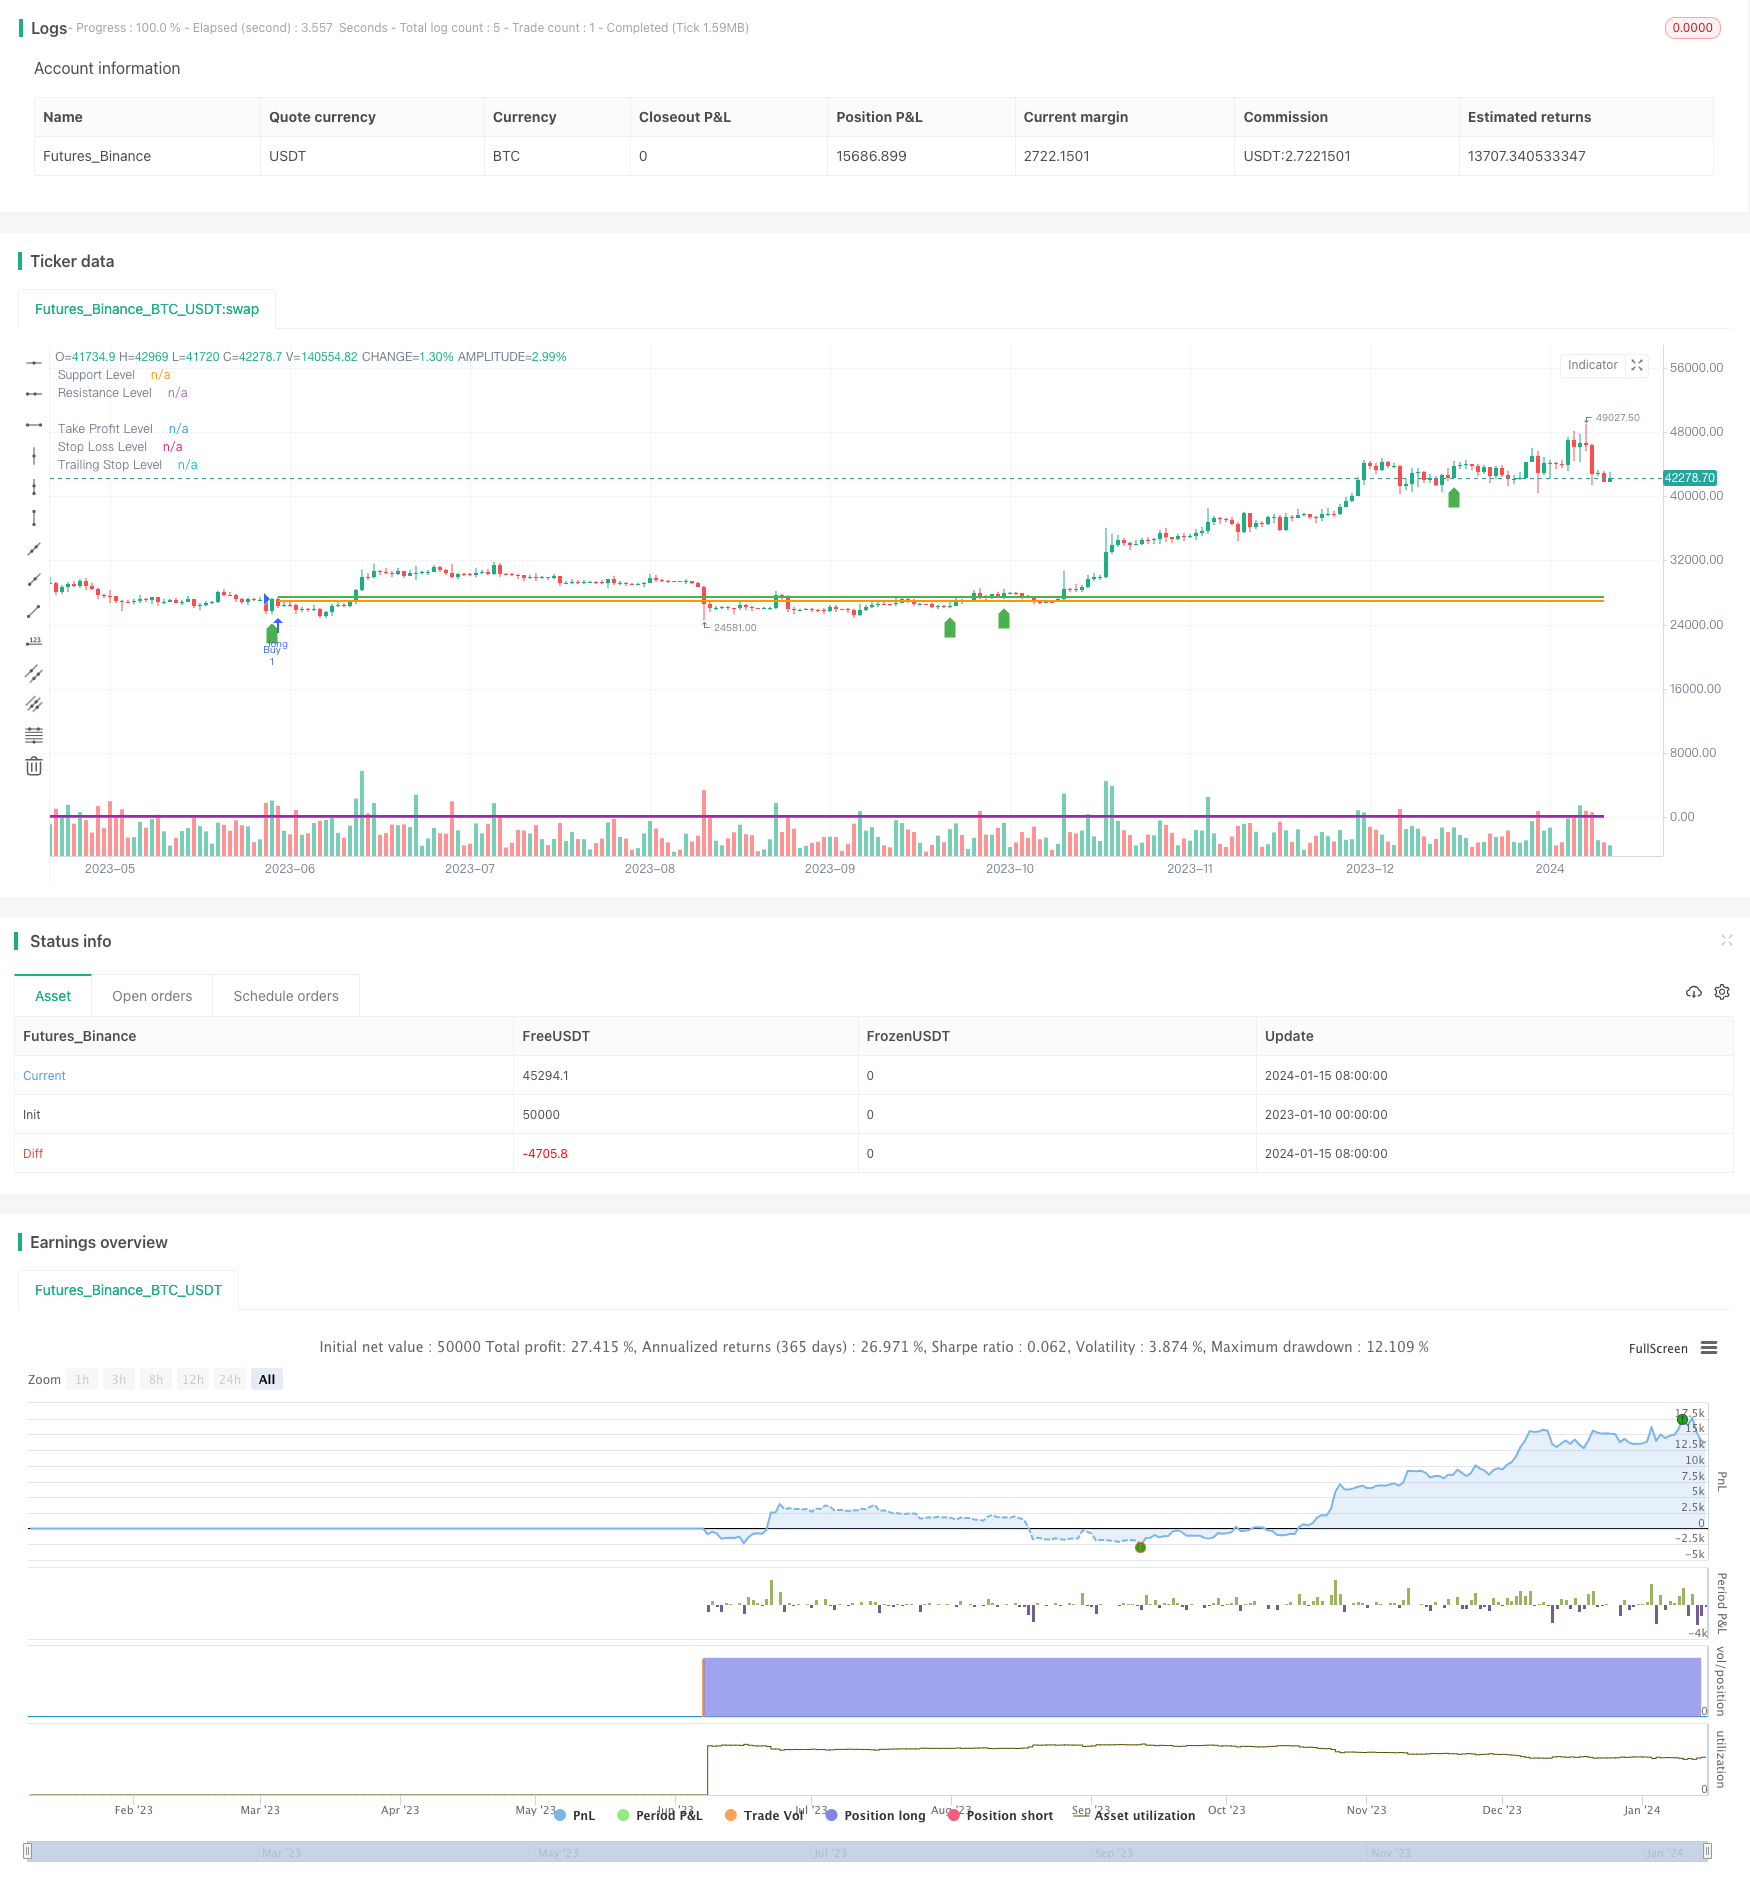
Name
基于均线价格形态和量能的反转策略-A-Trend-Reversal-Strategy-Based-on-Moving-Averages-Price-Patterns-and-Volume
Author
ChaoZhang
Strategy Description
这个策略运用了移动平均线、价格形态和交易量的组合来识别市场的反转点。当快速移动平均线上穿慢速移动平均线、并且出现多头吞噬形态、突破阻力位、交易量放大时,策略会做多;相反,当快速移动平均线下穿慢速移动平均线、并且出现空头吞噬形态、跌破支撑位、交易量放大时,策略会做空。
这个策略的核心思想是利用均线系统、价格形态和量能三者的组合来识别潜在的反转点。具体来说,均线的黄金交叉和死亡交叉可以判断趋势的转换。多头吞噬和空头吞噬这两种价格形态通常预示着短期反转。大量的交易量涌入也往往意味着即将出现的趋势反转。这三个信号的组合使用可以相对准确地把握住反转的时机。
从代码逻辑上看,首先计算快速移动平均线和慢速移动平均线。然后设置多头吞噬和空头吞噬的判断条件。同时还设置了支持阻力位和交易量放大的条件。满足均线黄金交叉、多头吞噬形态、突破阻力位和交易量放大时,发出做多信号;满足均线死亡交叉、空头吞噬形态、跌破支持位和交易量放大时,发出平仓信号。
这个策略最大的优势在于利用多种信号的组合来识别反转,这可以有效减少假信号。具体来说,仅仅依靠单一的均线、价格形态或者量能很容易造成错误的交易信号。但是如果三者同时出现信号,那么预测反转的成功率会大大提高。
另外,这个策略同时利用了趋势和反转两个因素。在出现反转信号之前,必须先有趋势的存在。也就是说,这个策略只会在趋势背景下寻找反转机会。这也降低了随机性,提高了盈利概率。
这个策略最大的风险在于反转失败,即发出做多信号后,价格继续向下;或者发出做空信号后,价格继续上涨。这通常是由于判断失误,反转信号只是个假象,或者只是短期的调整,之后继续原有趋势。
解决方法就是调整均线参数,识别更长周期的趋势;同时适当放大止损幅度,在反转失败后及时止损。此外,也可以结合更多因素来确认反转,比如请大周期的价格形态等。
这个策略可以通过以下几个方面来进行优化:
-
调整均线参数,识别更合适的长短周期。
-
测试不同的支持阻力位算法,如帕累托支撑阻力位。
-
尝试不同的交易量指标,如能量潮指标、交易量摆动指标等。
-
增加更多确认反转的信号,如长周期价格形态、成交量的剧烈放大等。
-
结合股指期货来进行跨市场确认,利用股指期货来确认个股的反转。
通过测试不同的参数组合,这个策略可以进一步优化,从而提高盈利率和胜率。
这个策略整合了均线系统、价格形态和交易量三个因素来识别反转,实现了多种信号的有效结合。它只在趋势的背景下寻找反转机会,避免了随机交易。通过进一步优化参数以及增加确认因素,这个策略可以成为一个非常实用的短线反转策略。
||
This strategy combines moving averages, price patterns and volume to identify potential trend reversal points in the market. It goes long when the fast moving average crosses above the slow moving average, a bullish engulfing pattern appears, resistance level breaks, and trading volume surges. It goes short when the opposite conditions occur.
The core idea of this strategy is to use a combination of moving averages, price action patterns and volume as signals for upcoming reversals. Specifically, golden crosses and death crosses of moving averages can indicate shifts in trend. Bullish/bearish engulfing patterns usually imply short-term reversals ahead. Surges in trading volume also often signify trend reversals. By combining all three types of signals, the strategy aims to accurately capture reversal turning points.
In terms of logic, the strategy first calculates fast and slow moving averages. Then it defines conditions to identify bullish/bearish engulfing patterns. Support and resistance levels are incorporated along with volume expansion as additional conditions. The buy signals trigger when the fast MA crosses above the slow MA, a bullish pattern appears, resistance breaks, and volume surges. The opposite conditions trigger sell signals.
The biggest advantage of this strategy is using a combination of multiple signals to confirm reversals, which helps avoid false signals. Relying solely on a single indicator like moving averages or candlestick patterns tends to produce erroneous trades. By requiring alignment of all three factors, the likelihood of accurately capturing reversals improves significantly.
Additionally, this strategy utilizes both trend and reversal concepts. Reversals are only sought after an existing trend. In other words, the strategy only looks for countertrend retracements within trending markets. This helps reduce randomness and boosts profitability.
The biggest risk of this strategy is failed reversals, where the price continues moving against the trade direction after entry signals. This typically happens when the reversal signals turn out to be false, or only short-term corrections within a persisting trend.
The solutions include adjusting moving average periods to define better trends, using wider stop losses, and incorporating more confirmation factors before trading reversal signals. Adding filters based on higher timeframe trends could also help avoid false breakout trades.
Possible optimization avenues for this strategy include:
-
Tuning moving average periods to identify optimal long/short term trends.
-
Testing different support/resistance calculation methods like Pivot Points.
-
Trying other volume indicators like Chaikin Money Flow, Volume Oscillator.
-
Incorporating more reversal confirmation factors like long-term chart patterns, huge volume spikes etc.
-
Using stock index futures to cross-verify signals across markets.
Through rigorous testing of parameter combinations, further improvements in performance can be achieved.
This strategy neatly combines moving averages, price action and volume to trade reversals only in trending markets. By optimizing the parameters and adding more signal confirmations, it can become a robust system for short-term countertrend trading. [/trans]
Strategy Arguments
| Argument | Default | Description |
|---|---|---|
| v_input_1 | 10 | Fast MA Length |
| v_input_2 | 20 | Slow MA Length |
| v_input_3 | true | Take Profit (%) |
| v_input_4 | true | Stop Loss (%) |
| v_input_5 | true | Trailing Stop (%) |
| v_input_6 | 100 | Support Level |
| v_input_7 | 200 | Resistance Level |
Source (PineScript)
/*backtest
start: 2023-01-10 00:00:00
end: 2024-01-16 00:00:00
period: 1d
basePeriod: 1h
exchanges: [{"eid":"Futures_Binance","currency":"BTC_USDT"}]
*/

//@version=5
strategy("Profit Table Strategy", overlay=true)

// Input parameters
fastLength = input(10, title="Fast MA Length")
slowLength = input(20, title="Slow MA Length")
takeProfitPercent = input(1, title="Take Profit (%)") / 100
stopLossPercent = input(1, title="Stop Loss (%)") / 100
trailingStopPercent = input(1, title="Trailing Stop (%)") / 100

// Price action conditions
bullishEngulfing = close > open and close > open[1] and open < close[1] and open[1] > close[1]
bearishEngulfing = close < open and close < open[1] and open > close[1] and open[1] < close[1]

// Support and resistance levels
supportLevel = input(100, title="Support Level")
resistanceLevel = input(200, title="Resistance Level")

// Volume conditions
volumeCondition = volume > ta.sma(volume, 20)

// Calculate moving averages
fastMA = ta.sma(close, fastLength)
slowMA = ta.sma(close, slowLength)

// Buy condition
buyCondition = (fastMA > slowMA) and (close > resistanceLevel) and bullishEngulfing and volumeCondition

// Sell condition
sellCondition = (fastMA < slowMA) and (close < supportLevel) and bearishEngulfing and volumeCondition

// Strategy logic
strategy.entry("Buy", strategy.long, when=buyCondition)
strategy.close("Buy", when=sellCondition)

// Calculate take profit, stop loss, and trailing stop levels
takeProfitLevel = strategy.position_avg_price * (1 + takeProfitPercent)
stopLossLevel = strategy.position_avg_price * (1 - stopLossPercent)
trailingStopLevel = strategy.position_avg_price * (1 - trailingStopPercent)

// Plotting levels on the chart
plot(supportLevel, color=color.blue, style=plot.style_line, linewidth=2, title="Support Level")
plot(resistanceLevel, color=color.purple, style=plot.style_line, linewidth=2, title="Resistance Level")
plot(takeProfitLevel, color=color.green, style=plot.style_line, linewidth=2, title="Take Profit Level")
plot(stopLossLevel, color=color.red, style=plot.style_line, linewidth=2, title="Stop Loss Level")
plot(trailingStopLevel, color=color.orange, style=plot.style_line, linewidth=2, title="Trailing Stop Level")

// Plotting buy and sell signals on the chart
plotshape(series=buyCondition, title="Buy Signal", color=color.green, style=shape.labelup, location=location.belowbar)
plotshape(series=sellCondition, title="Sell Signal", color=color.red, style=shape.labeldown, location=location.abovebar)
Detail
https://www.fmz.com/strategy/439107
Last Modified
2024-01-17 17:48:40
