Name
基于均线交叉的趋势追踪策略Trend-Tracking-Strategy-Based-on-Moving-Average-Crossover
Author
ChaoZhang
Strategy Description
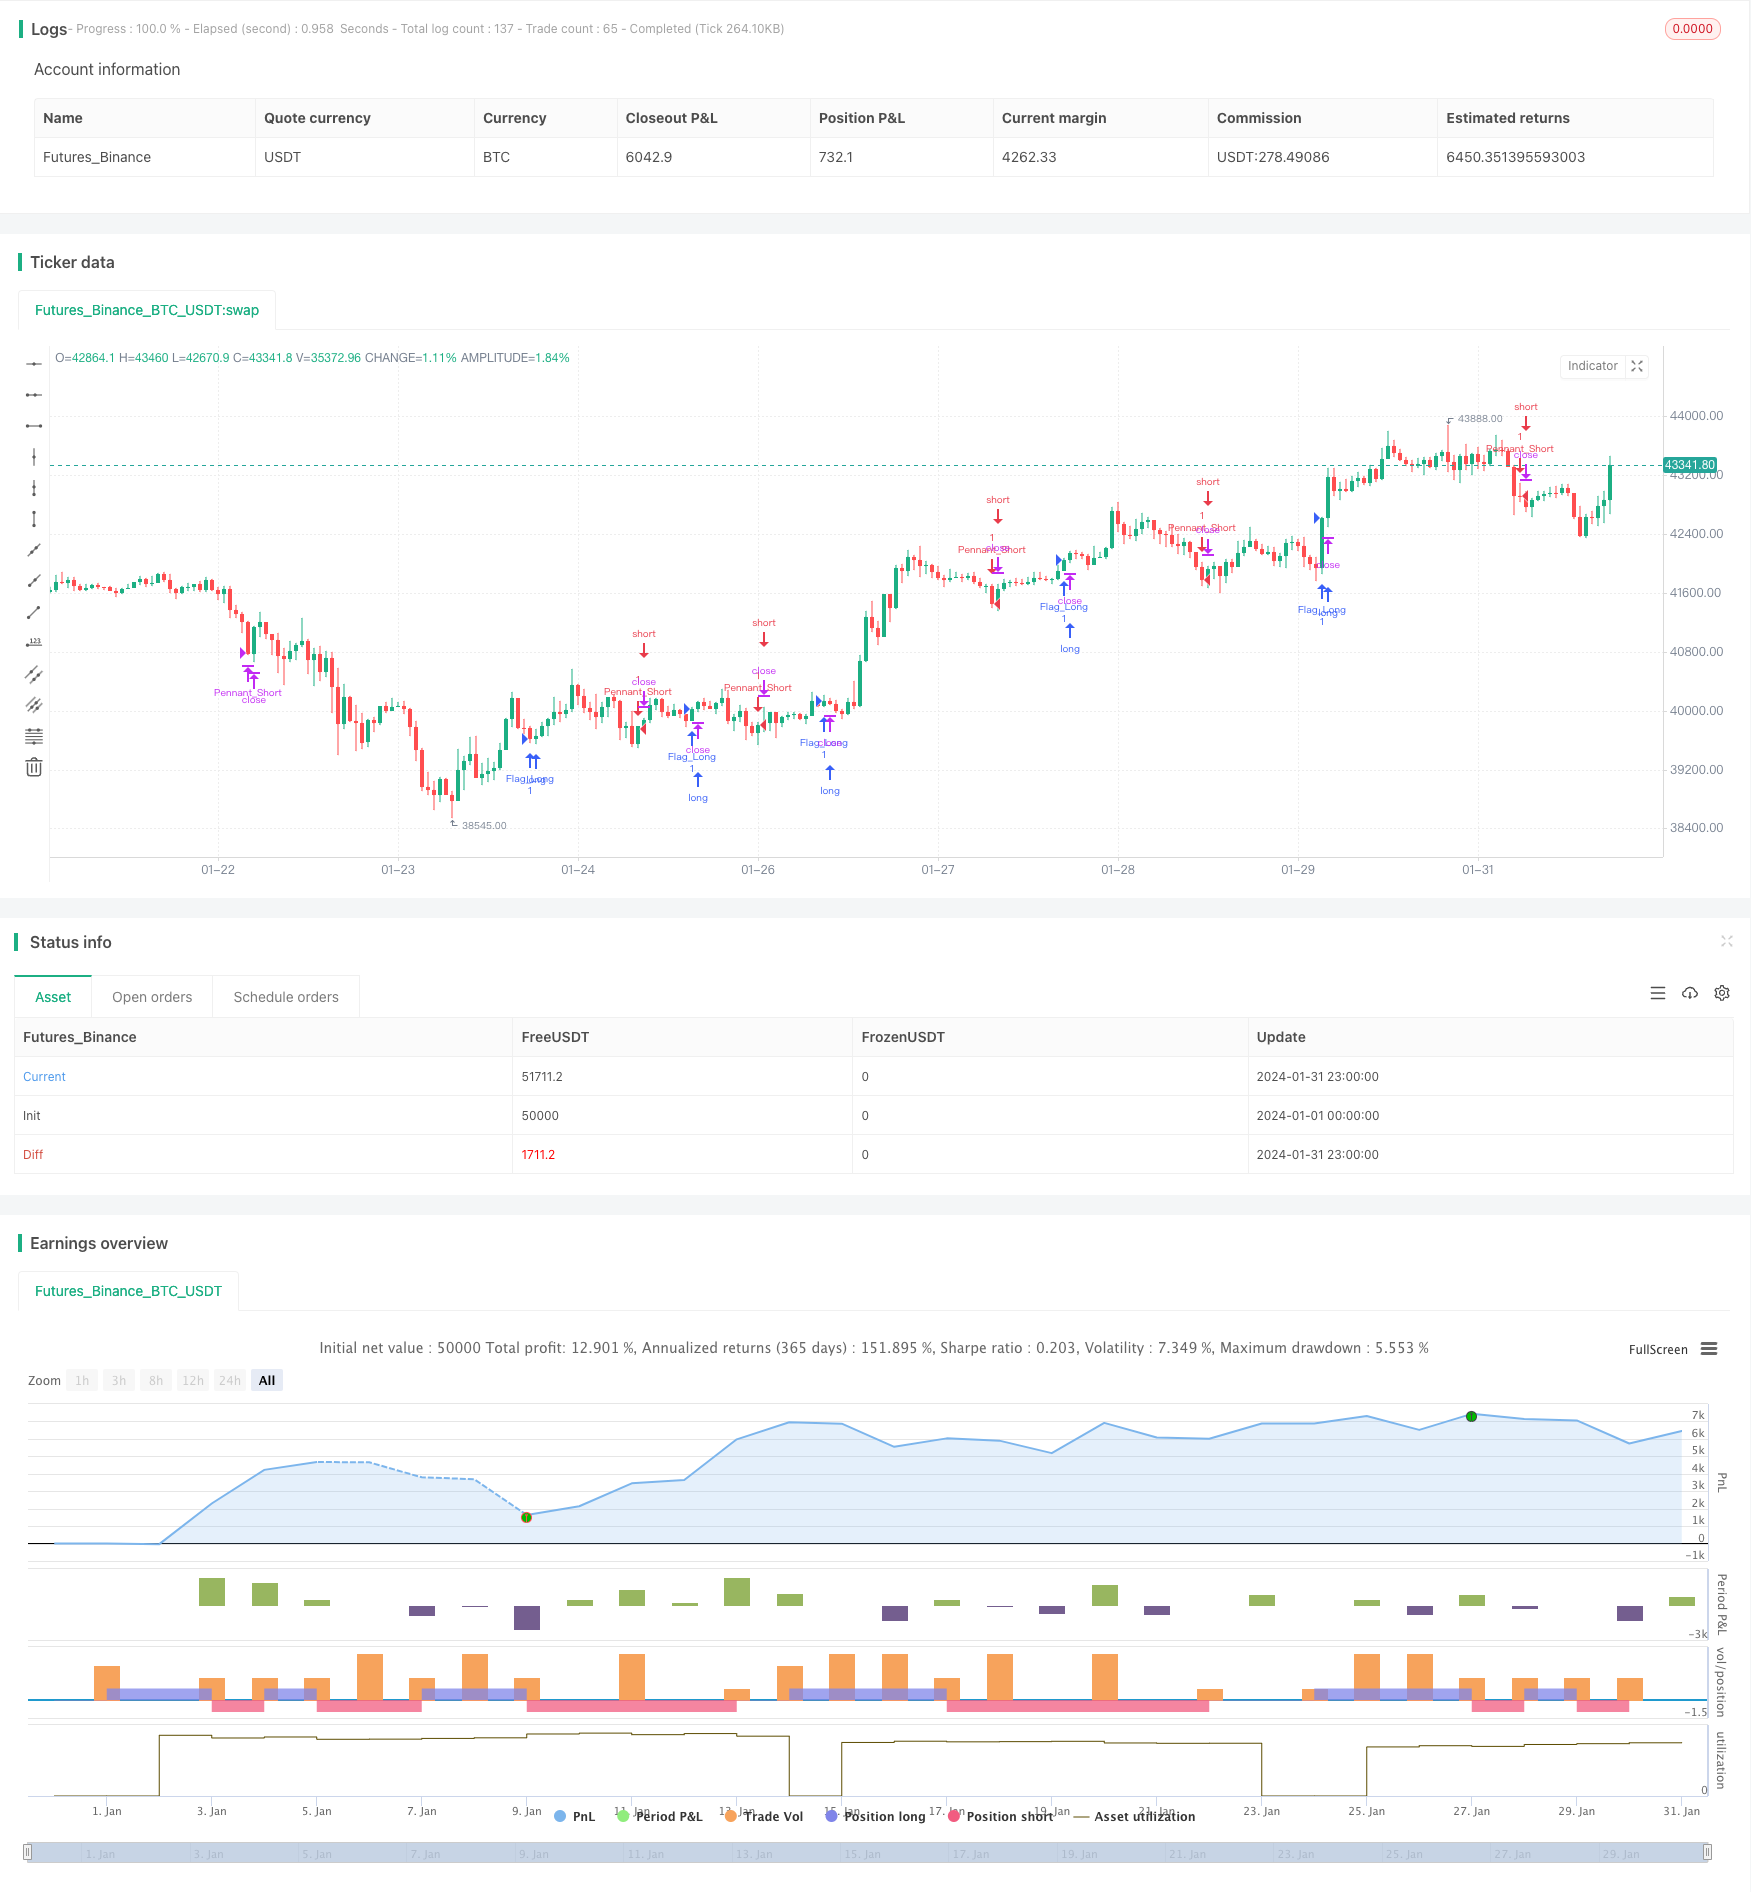
本策略是一个基于均线交叉来判断市场趋势方向,并追踪趋势的量化交易策略。该策略运用了多组不同参数的简单移动平均线的交叉来判断买入和卖出时间点。
该策略主要判断规则如下:
- 当短期均线从下方向上突破长期均线时,表明行情可能正在进入多头趋势,此时做多;
- 当短期均线从上方向下跌破长期均线时,表明行情可能正在进入空头趋势,此时做空;
- 使用不同参数的均线判断不同级别的趋势,实现不同时间段内的趋势追踪。
具体而言,策略中使用了20日线,30日线,50日线,60日线和200日线这5条移动平均线。当20日线向上交叉50日线时判断为买入信号;当10日线向下交叉30日线时判断为卖出信号。使用不同参数的均线,可以判断更长期和更短期的趋势方向。
这种基于均线交叉的趋势追踪策略具有以下优势:
- 操作简单,容易理解和实现;
- 可以有效地判断市场趋势方向和强弱;
- 不同参数设置可以实现不同时间段内的趋势追踪;
- 可定制化程度高,可以根据自己的需要调整均线参数。
该策略也存在一些风险:
- 均线具有滞后性,可能会产生一定的迟滞;
- 错误的均线参数设置可能导致过多的交易信号和不必要的损失;
- 需要注意避免在盘整行情中使用该策略,应该在明确的趋势行情中使用。
为了降低风险,我们可以调整均线参数,优化参数设置,同时辅助使用其他指标进行决策。
我们可以从以下几个方面来优化改进该策略:
- 优化均线参数,找到最优参数组合,降低交易频率的同时提高盈利率;
- 增加其他技术指标进行辅助,例如RSI,KD等,提高决策的准确性;
- 添加止损策略,及时止损退出可以有效控制风险;
- 结合复杂的机器学习模型进行参数优化和策略评估,不断迭代升级。
本策略是一个非常基础的趋势追踪策略。它使用均线交叉原理判断市场趋势方向,简单有效,容易理解实现。我们可以在此基础之上进行大量扩展与优化,使其适用于更复杂的量化交易。总的来说,这是一个非常好的策略基础框架。
||
This strategy is a quantitative trading strategy that judges market trend direction based on moving average crossover and tracks the trend. It uses the crossovers of simple moving averages with different parameters to determine the entry and exit points.
The main judgment rules of this strategy are:
-
When the short-term moving average crosses above the long-term moving average from the bottom, it indicates that the market may be entering an uptrend, then go long;
-
When the short-term moving average crosses below the long-term moving average from the top, it indicates that the market may be entering a downtrend, then go short;
-
Use moving averages with different parameters to judge trends at different timescales and track trends at different levels.
Specifically, the strategy uses 5 moving averages - 20-day, 30-day, 50-day, 60-day and 200-day. When 20-day MA crosses above 50-day MA, it is a buy signal; When 10-day MA crosses below 30-day MA, it is a sell signal. Using MAs of different parameters can tell trends in both longer and shorter timescales.
This trend tracking strategy based on MA crossover has the following advantages:
- Simple to understand and implement;
- Can effectively determine market trend direction and strength;
- Different parameter settings allow tracking trends at different timescales;
- Highly customizable based on needs by adjusting MA parameters.
There are also some risks with this strategy:
- MAs have lagging nature, which may cause certain delays;
- Wrong MA parameter settings may lead to excessive trading signals and unnecessary losses;
- Avoid using this strategy during market consolidation, use it only during obvious trending markets.
To reduce risks, we can adjust MA parameters, optimize parameter settings, and use other indicators to aid decision making.
We can optimize this strategy in the following areas:
- Optimize MA parameters to find the optimal parameter combination, reduce trading frequency while improving profit rate;
- Incorporate other technical indicators like RSI, KD to improve decision accuracy;
- Add stop loss strategies to control risks effectively;
- Combine complex machine learning models for parameter optimization and strategy evaluation, continuously iterate and upgrade.
This is a very basic trend tracking strategy. It uses MA crossover principle to determine market trend direction, simple and effective, easy to understand and implement. We can make lots of expansions and optimizations to make it suitable for more complex quantitative trading. Overall this is a great strategy framework to build upon.
[/trans]
Source (PineScript)
/*backtest
start: 2024-01-01 00:00:00
end: 2024-01-31 23:59:59
period: 1h
basePeriod: 15m
exchanges: [{"eid":"Futures_Binance","currency":"BTC_USDT"}]
*/

//@version=5
strategy("Grafik Formasyonları Alım-Satım Stratejisi", overlay=true)

// Inverse Head and Shoulders (İnverse Omuz-Baş-Omuz)
ihs_condition = ta.crossover(ta.sma(close, 50), ta.sma(close, 200))

// Head and Shoulders (Omuz-Baş-Omuz)
hs_condition = ta.crossunder(ta.sma(close, 50), ta.sma(close, 200))

// Flag Pattern (Bayrak Formasyonu)
flag_condition = ta.crossover(ta.sma(close, 10), ta.sma(close, 30))

// Triangle Pattern (Trekgen Formasyonu)
triangle_condition = ta.crossover(ta.sma(close, 20), ta.sma(close, 50))

// Pennant Pattern (Ters Bayrak Formasyonu)
pennant_condition = ta.crossunder(ta.sma(close, 10), ta.sma(close, 20))

// Inverse Triangle Pattern (Ters Üçgen Formasyonu)
inverse_triangle_condition = ta.crossunder(ta.sma(close, 30), ta.sma(close, 60))

// Alım-Satım Sinyalleri
if (ihs_condition)
    strategy.entry("İHS_Long", strategy.long)
if (hs_condition)
    strategy.close("İHS_Long")
if (flag_condition)
    strategy.entry("Flag_Long", strategy.long)
if (triangle_condition)
    strategy.entry("Triangle_Long", strategy.long)
if (pennant_condition)
    strategy.entry("Pennant_Short", strategy.short)
if (inverse_triangle_condition)
    strategy.close("Pennant_Short")
Detail
https://www.fmz.com/strategy/442509
Last Modified
2024-02-22 14:02:03
