Name
基于均线交叉的趋势追踪策略Trend-Following-Strategy-Based-on-Moving-Average-Crossover
Author
ChaoZhang
Strategy Description
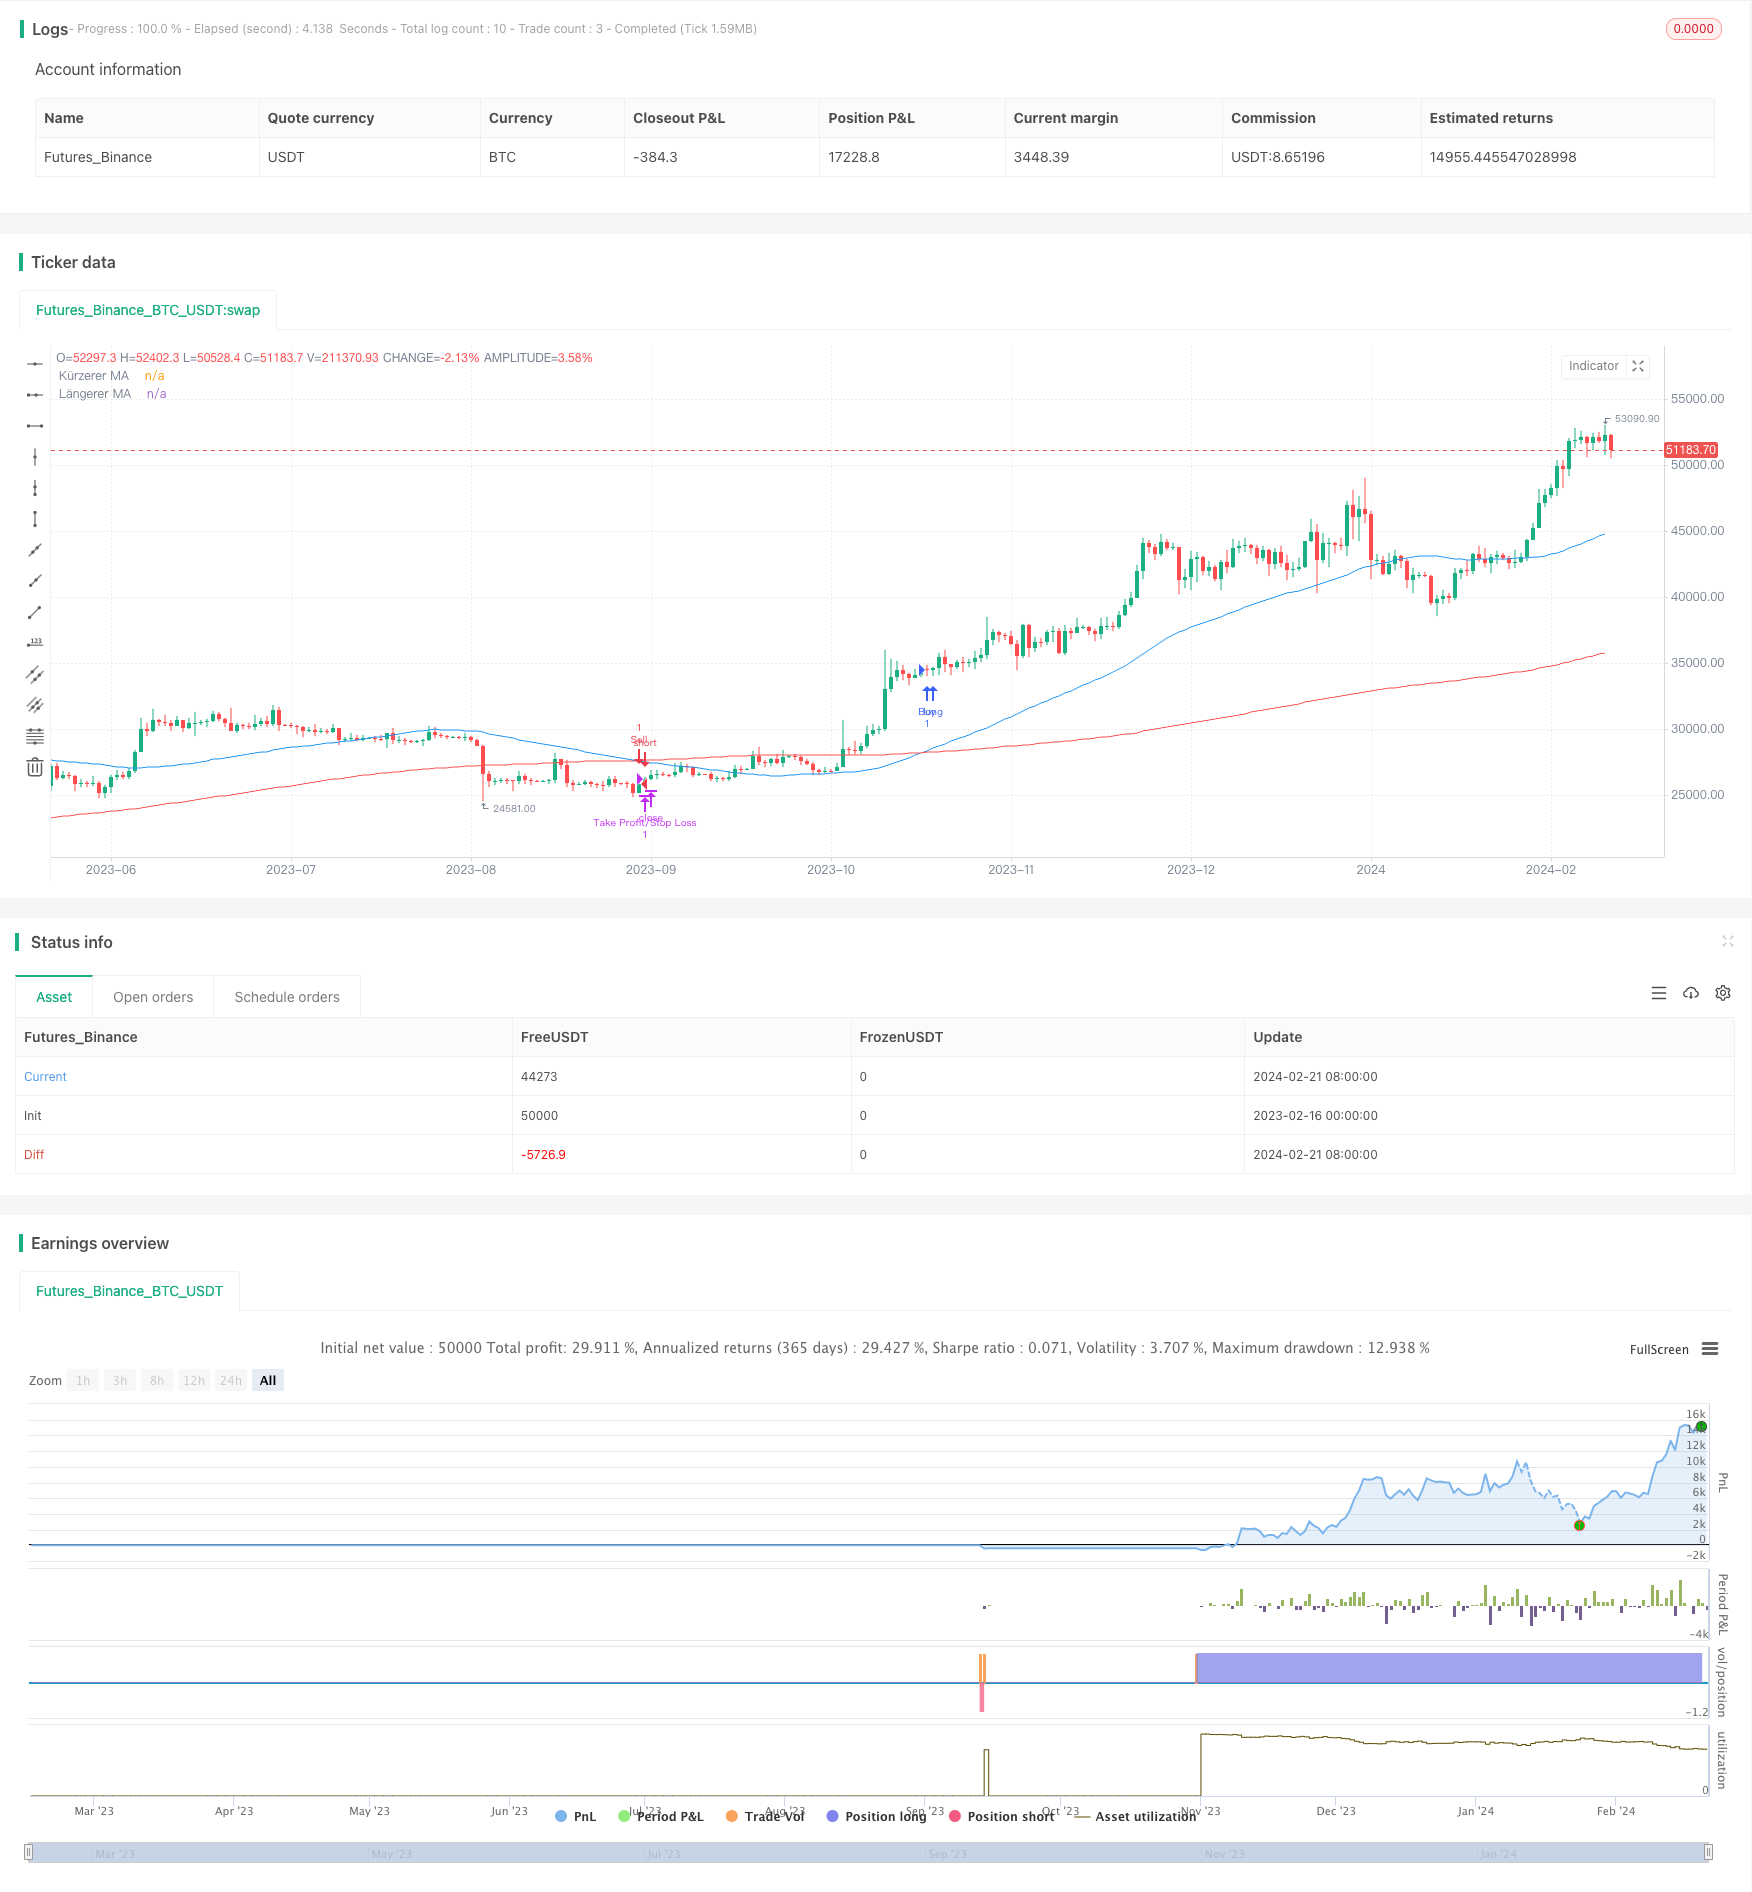
本策略基于移动平均线的金叉死叉原理设计。通过计算快线(短期移动平均线)和慢线(长期移动平均线)的交叉情况,判断市场趋势,实现趋势追踪。当快线从下向上突破慢线时,产生买入信号;当快线从上向下跌破慢线时,产生卖出信号。
该策略主要依赖均线交叉原理。快线参数设置为50天,慢线参数设置为200天。计算最近50天和200天的收盘价平均值,分别作为快线和慢线。当快线从下方向上突破慢线时,判断为股票价格进入上升趋势,产生买入信号;当快线从上方向下跌破慢线时,判断为股票价格进入下跌趋势,产生卖出信号。
通过设置不同参数的快慢线组合,可以调整策略的敏感度。快线参数越小,确定趋势的速度更快,但是可能产生更多假信号。慢线参数越大,判断趋势的效果更好,但是确定趋势速度较慢。本策略使用50和200天移动平均线,综合考虑了策略的灵敏度和稳定性。
- 使用移动平均线交叉原理,可以有效判断市场走势和趋势转折点,自动追踪趋势运行
- 快慢线参数设置合理,既足够敏感,也能过滤噪音,判断市场趋势效果较好
- 策略理解简单,逻辑清晰,参数设置灵活,容易实现和优化
- 可严格控制止损点,有利于风险控制
- 移动平均线策略可能产生较多反转信号或假信号,需要辅助其他指标过滤
- 行情震荡时,可能产生错误交易信号,需要评估特定股票的波动频率
- 停损点设定需要考量个股特性,过于严格可能增加成本,过于宽松可能加大损失
- 结合其他技术指标,如MACD、KD等,过滤假信号
- 根据个股特性和波动频率设置移动平均线参数
- 针对高波动股调整止损距离
- 测试不同参数组合优化策略
- 增加开仓和加仓规则
本策略利用均线交叉原理自动判断市场趋势方向并追踪运行,可有效把握主要趋势。通过快慢均线的参数设置控制策略的灵敏度,并辅助其他指标过滤信号可实现策略稳定性和效果的平衡。该策略适合中长线操作,可根据股票和行情特征进行参数调整,扩展入场和止损规则进行优化,从而获得更好的交易效果。
||
This strategy is designed based on the principle of golden cross and death cross of moving averages. By calculating the crossover situations between the fast line (short-term moving average) and the slow line (long-term moving average), it judges the market trend and realizes trend following. When the fast line breaks through the slow line upward, a buy signal is generated. When the fast line breaks through the slow line downward, a sell signal is generated.
The strategy mainly relies on the principle of moving average crossover. The fast line parameter is set to 50 days and the slow line parameter is set to 200 days. Calculate the average closing price over the most recent 50 and 200 days respectively as the fast line and slow line. When the fast line breaks through the slow line upward, it is determined that the stock price has entered an upward trend and a buy signal is generated. When the fast line breaks through the slow line downward, it is determined that the stock price has entered a downward trend and a sell signal is generated.
By setting fast and slow line combinations with different parameters, the sensitivity of the strategy can be adjusted. The smaller the fast line parameter, the faster the determination of the trend, but there may be more false signals. The larger the slow line parameter, the better the trend judgment, but the slower the determination of the trend. This strategy uses 50 and 200-day moving averages, comprehensively considering the sensitivity and stability of the strategy.
- Effectively determine market trends and inflection points by using moving average crossover principle to automatically track trends
- Reasonable fast and slow line parameter settings make it sensitive enough while filtering noise to effectively determine market trends
- Easy to understand strategy logic and clear parameters setting make it easy to implement and optimize
- Strict stop loss control contributes to risk management
- Moving average strategies may produce more reversal or false signals, requiring assistance from other indicators for filtering
- Volatile markets may generate wrong trading signals, requiring assessment of fluctuations frequency of specific stocks
- Setting stop loss points needs to take into account the characteristics of individual stocks. Too strict may increase costs while too loose may increase losses
- Combine other technical indicators such as MACD and KD to filter false signals
- Set moving average parameters based on characteristics and frequency of fluctuations of individual stocks
- Adjust stop loss distance for highly volatile stocks
- Test different parameter combinations to optimize the strategy
- Increase open positions and add positions rules
This strategy utilizes the principle of moving average crossover to automatically determine the trend direction of the market and track the trend, which can effectively capture the main trend. By setting parameters of fast and slow moving averages to control the sensitivity of the strategy and filtering signals with other auxiliary indicators, the stability and effectiveness of the strategy can be balanced. This strategy is suitable for medium and long term operations. Parameters can be adjusted according to the characteristics of stocks and markets. Expanding entry and stop loss rules can further optimize it to obtain better trading performance.
[/trans]
Strategy Arguments
| Argument | Default | Description |
|---|---|---|
| v_input_1 | 50 | Kürzerer MA Länge |
| v_input_2 | 200 | Längerer MA Länge |
Source (PineScript)
/*backtest
start: 2023-02-16 00:00:00
end: 2024-02-22 00:00:00
period: 1d
basePeriod: 1h
exchanges: [{"eid":"Futures_Binance","currency":"BTC_USDT"}]
*/

//@version=5
strategy("Gleitend Strategie", overlay=true)

// Einstellungen für die gleitenden Durchschnitte
short_MA_length = input(50, title="Kürzerer MA Länge")
long_MA_length = input(200, title="Längerer MA Länge")

// Berechnung der gleitenden Durchschnitte
short_MA = ta.sma(close, short_MA_length)
long_MA = ta.sma(close, long_MA_length)

// Kaufsignal: Kürzerer MA über Längerer MA
buy_signal = ta.crossover(short_MA, long_MA)

// Verkaufssignal: Kürzerer MA unter Längerer MA
sell_signal = ta.crossunder(short_MA, long_MA)

// Stop Loss und Take Profit Ebenen
stop_loss = strategy.position_avg_price * 0.985
take_profit = strategy.position_avg_price * 1.02

// Trading-Logik
if (buy_signal)
    strategy.entry("Buy", strategy.long)

if (sell_signal)
    strategy.close("Buy")

strategy.exit("Take Profit/Stop Loss", "Buy", stop=stop_loss, limit=take_profit)

// Bedingungen für Short-Positionen
if (sell_signal)
    strategy.entry("Sell", strategy.short)

strategy.exit("Take Profit/Stop Loss", "Sell", stop=stop_loss, limit=take_profit)

// Plot der gleitenden Durchschnitte
plot(short_MA, color=color.blue, title="Kürzerer MA")
plot(long_MA, color=color.red, title="Längerer MA")
Detail
https://www.fmz.com/strategy/442657
Last Modified
2024-02-23 15:14:31
