Name
基于吞噬模型与量化指标的高级趋势跟踪策略Advanced-Trend-Tracking-Strategy-Based-on-Engulfing-Pattern-and-Quantitative-Indicators
Author
ChaoZhang
Strategy Description
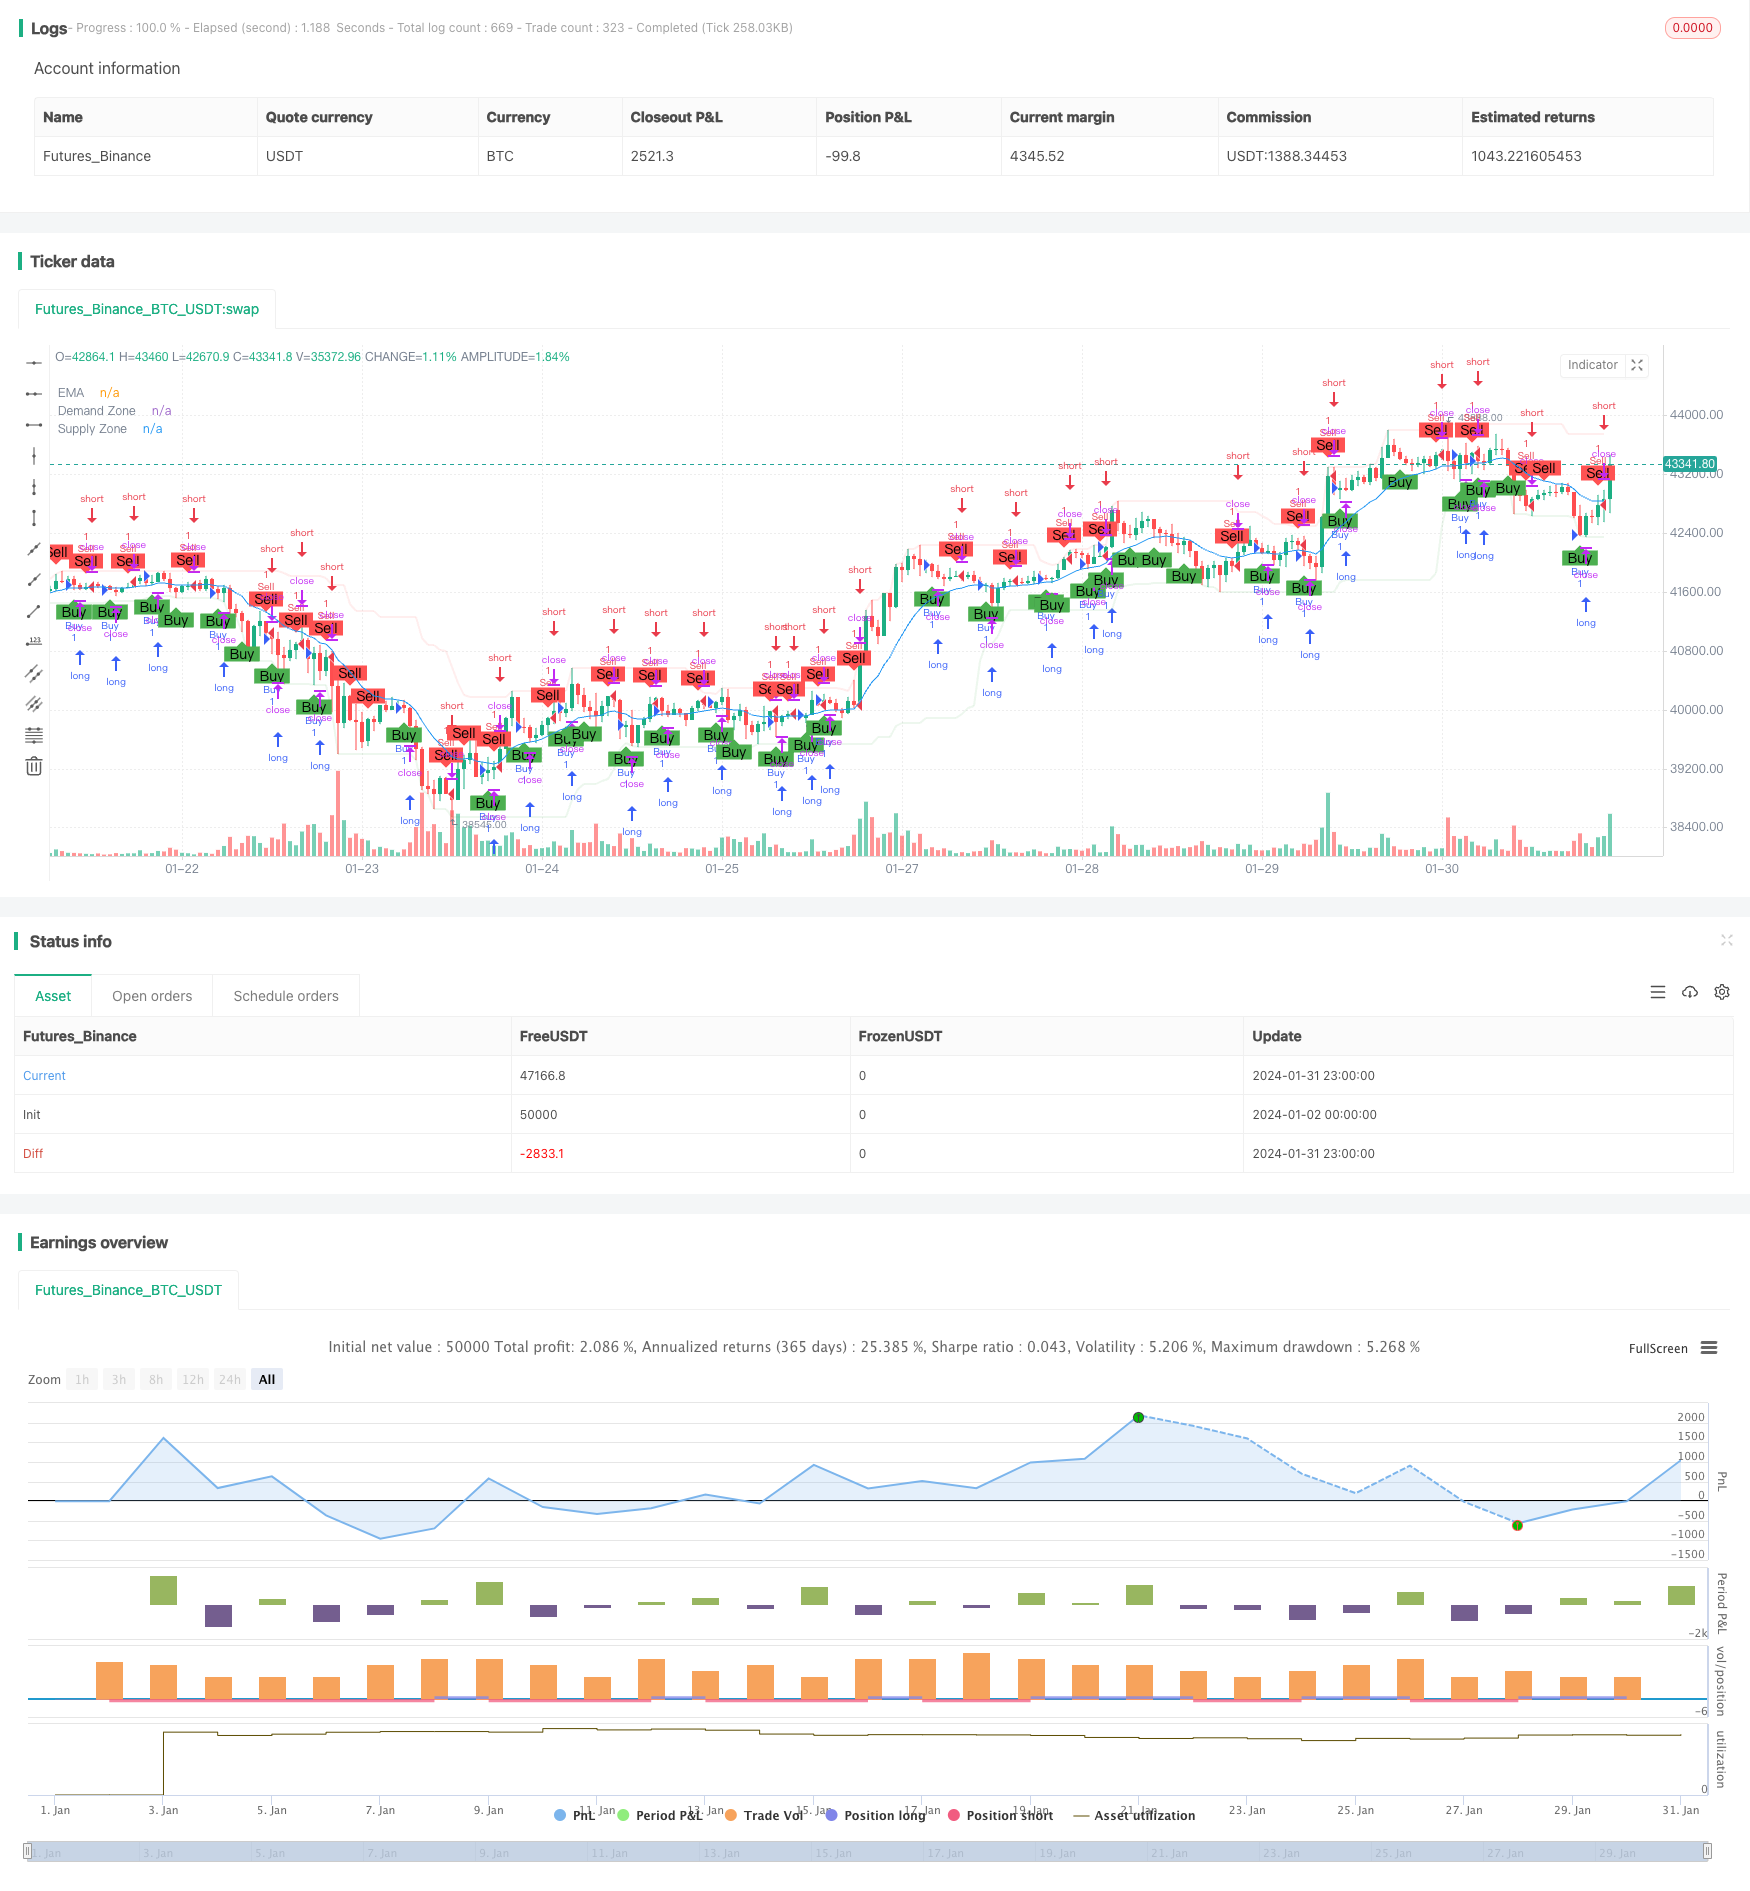
本策略通过融合吞噬K线形态识别、震荡指标、均线指标、供需区等多种量化技术指标,实现对趋势的精确判断和跟踪交易。该策略广泛运用了量化交易的专业术语和标准模型,通过多指标综合判断提高决策的准确性,有效控制风险。
本策略的核心逻辑基于对吞噬形态K线的识别,以捕捉市场的迹象反转。当出现多头吞噬形态时,close[1] > open[1] and open < close and close > open[1] and open[1] > close[1],买入信号触发;出现空头吞噬形态时,close[1] < open[1] and open > close and close < open[1] and open[1] < close[1],卖出信号触发。
此外,策略还引入了20周期的需求区和供给区指标,当close突破供给区时判断为多头信号,突破需求区则为空头信号。EMA均线被用来判断趋势方向,只有close突破EMA才产生交易信号。而通过查找枢轴点的震荡指标fractal,辅助确定反转的时间点。
综上,该策略通过吞噬形态判断潜在反转,并用均线、供需区等滤波和确认,最终仅在高概率点发出信号,从而准确跟踪趋势,避免被震荡市耗尽资金。
这是一个非常专业和高级的趋势跟踪策略,主要有以下优势:
- 多指标组合,提高判断准确性,有效过滤假信号
- 吞噬形态判断反转迹象,捕捉转折点
- 结合趋势、震荡等指标,判断高概率交易点
- 自动绘制形态、指标,清晰可读
- 简洁的策略逻辑,易扩展和优化
总体来说,该策略准确性高、风险控制好,适合追踪中长线趋势,可以获得稳定收益。
尽管该策略有许多优点,但仍存在一些潜在风险需要注意:
- 吞噬形态识别不准确,可能漏掉真实反转或者产生假信号
- 均线系统发出错误信号的概率存在,可能追高杀低
- 需求区和供给区范围设置不当,增加了不必要的交易
- 优化空间有限,雪崩风险较高
对策为:
- 反转形态可引入机器学习等方法提升识别准确率
- 增加趋势暴力的判断指标,避免不必要损失
- 动态优化需求区和供给区参数
- 合理评估和控制风险,调整仓位规模
本策略还有进一步优化的空间:
- 增加基于机器学习的形态识别模块,利用AI判断吞噬和反转信号
- 引入更多滤波指标,如BOLL通道、MACD等判断入市时机
- 增加止损策略,如移动止损、时间止损等
- 动态优化指标参数,适应不同品种和市场环境
- 结合高级策略,如追踪止损、马丁格尔等管理资金曲线
通过以上优化,可以获得更准确判断,更低的风险,更顺畅的收益曲线。
本策略总体来说非常专业和高效,充分运用了量化交易的多种指标和模型对市场变化进行判断,通过吞噬形态捕捉反转信号,配合趋势、震荡指标发出高概率交易信号,可以有效跟踪中长线趋势,获得稳定收益。同时也需要注意一定的风险,通过持续优化和严格的资金管理,可以大幅降低风险,使策略更加可靠。该策略有很强的实用性和扩展性,适合有一定量化基础的交易者使用。
||
This strategy integrates multiple quantitative techniques such as engulfing candlestick pattern recognition, oscillators, moving average, and demand-supply zones to precisely determine and trade the trend. It extensively employs professional terminology and standard models of quantitative trading to improve decision accuracy through composite indicator judgment and effectively control risks.
The core logic of this strategy is based on identifying the engulfing candlestick patterns to catch turnarounds in the market. When a bullish engulfing pattern appears, close[1] > open[1] and open < close and close > open[1] and open[1] > close[1], a buy signal is triggered. When a bearish engulf pattern appears, close[1] < open[1] and open > close and close < open[1] and open[1] < close[1], a sell signal is triggered.
In addition, a 20-period demand zone and supply zone indicator is introduced. When the close breaks through the supply zone, it is determined as a bullish signal. When it breaks through the demand zone, it is determined as a bearish signal. The EMA moving average is used to determine the trend direction. Trading signals are generated only when the close breaks through the EMA. The fractal oscillator that finds pivot points assists in confirming the time of reversals.
In summary, this strategy determines potential reversals through engulfing patterns and uses filters like moving averages and supply-demand zones to confirm and trade only the highest probability points, thereby accurately tracking trends and avoiding losing all capital to whipsaws.
This is a highly professional and advanced trend tracking strategy with the following main advantages:
- Multiple indicator combo improves judgment accuracy and effectively filters false signals
- Engulfing patterns catch reversals
- Oscillators and trends determine high probability trade points
- Automatic pattern and indicator plotting, readable
- Concise logic, easily extensible and optimizable
Overall, this strategy has high accuracy and good risk control. It is suitable for mid-to-long term trend tracking and can deliver steady profits.
Despite its numerous strengths, some potential risks to note:
- Inaccurate engulfing pattern recognition might miss actual reversals or generate false signals
- Wrong signals probability exists in moving average systems, may buy the top and sell the bottom
- Improper demand zone and supply zone range setting increases unnecessary trades
- Limited optimization space, higher avalanche risks
Countermeasures:
- Introduce machine learning to improve reversal pattern recognition accuracy
- Add indicators judging violent trend to avoid unnecessary losses
- Dynamically optimize demand and supply zone parameters
- Reasonably assess and control risks, adjust position sizing
Further optimization directions:
- Add AI-based pattern recognition module using machine learning for engulfing and reversals
- Introduce more filters like BOLL and MACD for timing
- Add stop loss strategies like trailing stop loss and time-based stop loss
- Dynamically optimize indicator parameters for different products and markets
- Incorporate advanced strategies like trailing stops and martingale to manage equity curve
The above optimizations can improve accuracy, reduce risks, and smooth equity curve.
In summary, this is an extremely professional and efficient strategy that fully utilizes multiple quantitative indicators and models to judge market changes. It captures reversal signals through engulfing patterns and issues high probability trading signals collaborating with trend and oscillator indicators. This allows effective mid-to-long term trend tracking and steady profits. Meanwhile, certain risks need attention. Continual optimizations and strict risk management significantly lower risks, making the strategy more reliable. It has strong practicality and extensibility, suitable for traders with some quantitative basis.
[/trans]
Strategy Arguments
| Argument | Default | Description |
|---|---|---|
| v_input_1 | 14 | EMA Length |
| v_input_2 | 20 | Demand & Supply Length |
Source (PineScript)
/*backtest
start: 2024-01-02 00:00:00
end: 2024-02-01 00:00:00
period: 1h
basePeriod: 15m
exchanges: [{"eid":"Futures_Binance","currency":"BTC_USDT"}]
*/

//@version=5
strategy("Engulfing Candles with Fractals, Moving Average, Demand & Supply", overlay=true)

// Input parameters
emaLength = input(14, title="EMA Length")
demandSupplyLength = input(20, title="Demand & Supply Length")

// Calculate EMA
emaValue = ta.ema(close, emaLength)

// Calculate Demand and Supply Zones
demandZone = ta.lowest(low, demandSupplyLength)
supplyZone = ta.highest(high, demandSupplyLength)

// Plot Demand and Supply Zones
plot(demandZone, color=color.new(color.green, 90), linewidth=2, title="Demand Zone")
plot(supplyZone, color=color.new(color.red, 90), linewidth=2, title="Supply Zone")

// Determine Engulfing Candles
bullishEngulfing = close[1] > open[1] and open < close and close > open[1] and open[1] > close[1]
bearishEngulfing = close[1] < open[1] and open > close and close < open[1] and open[1] < close[1]

// Plot Engulfing Candle Bars
bgcolor(bullishEngulfing ? color.new(color.green, 90) : na)
bgcolor(bearishEngulfing ? color.new(color.red, 90) : na)

// Plot Moving Average
plot(emaValue, color=color.blue, title="EMA")

// Fractal Indicator
fractalUp = ta.pivothigh(high, 2, 2)
fractalDown = ta.pivotlow(low, 2, 2)

// Plot Buy and Sell Fractals
plotshape(series=fractalUp, title="Buy Fractal", location=location.belowbar, color=color.green, style=shape.labelup, text="Buy")
plotshape(series=fractalDown, title="Sell Fractal", location=location.abovebar, color=color.red, style=shape.labeldown, text="Sell")

// Strategy logic
buySignal = bullishEngulfing and close > emaValue and close > supplyZone
sellSignal = bearishEngulfing and close < emaValue and close < demandZone

// Execute strategy
if (fractalUp)
    strategy.entry("Buy", strategy.long)

if (fractalDown)
    strategy.entry("Sell", strategy.short)

// Plot strategy entry points on the chart
plotshape(series=buySignal ? 1 : na, title="Buy Signal", color=color.green, style=shape.triangleup, location=location.belowbar, size=size.small)
plotshape(series=sellSignal ? 1 : na, title="Sell Signal", color=color.red, style=shape.triangledown, location=location.abovebar, size=size.small)
Detail
https://www.fmz.com/strategy/440845
Last Modified
2024-02-02 16:48:30
