Name
基于双MA叠加的自适应回测时间范围选择策略Adaptive-Backtest-Date-Range-Selection-Strategy-Based-on-Double-MA
Author
ChaoZhang
Strategy Description
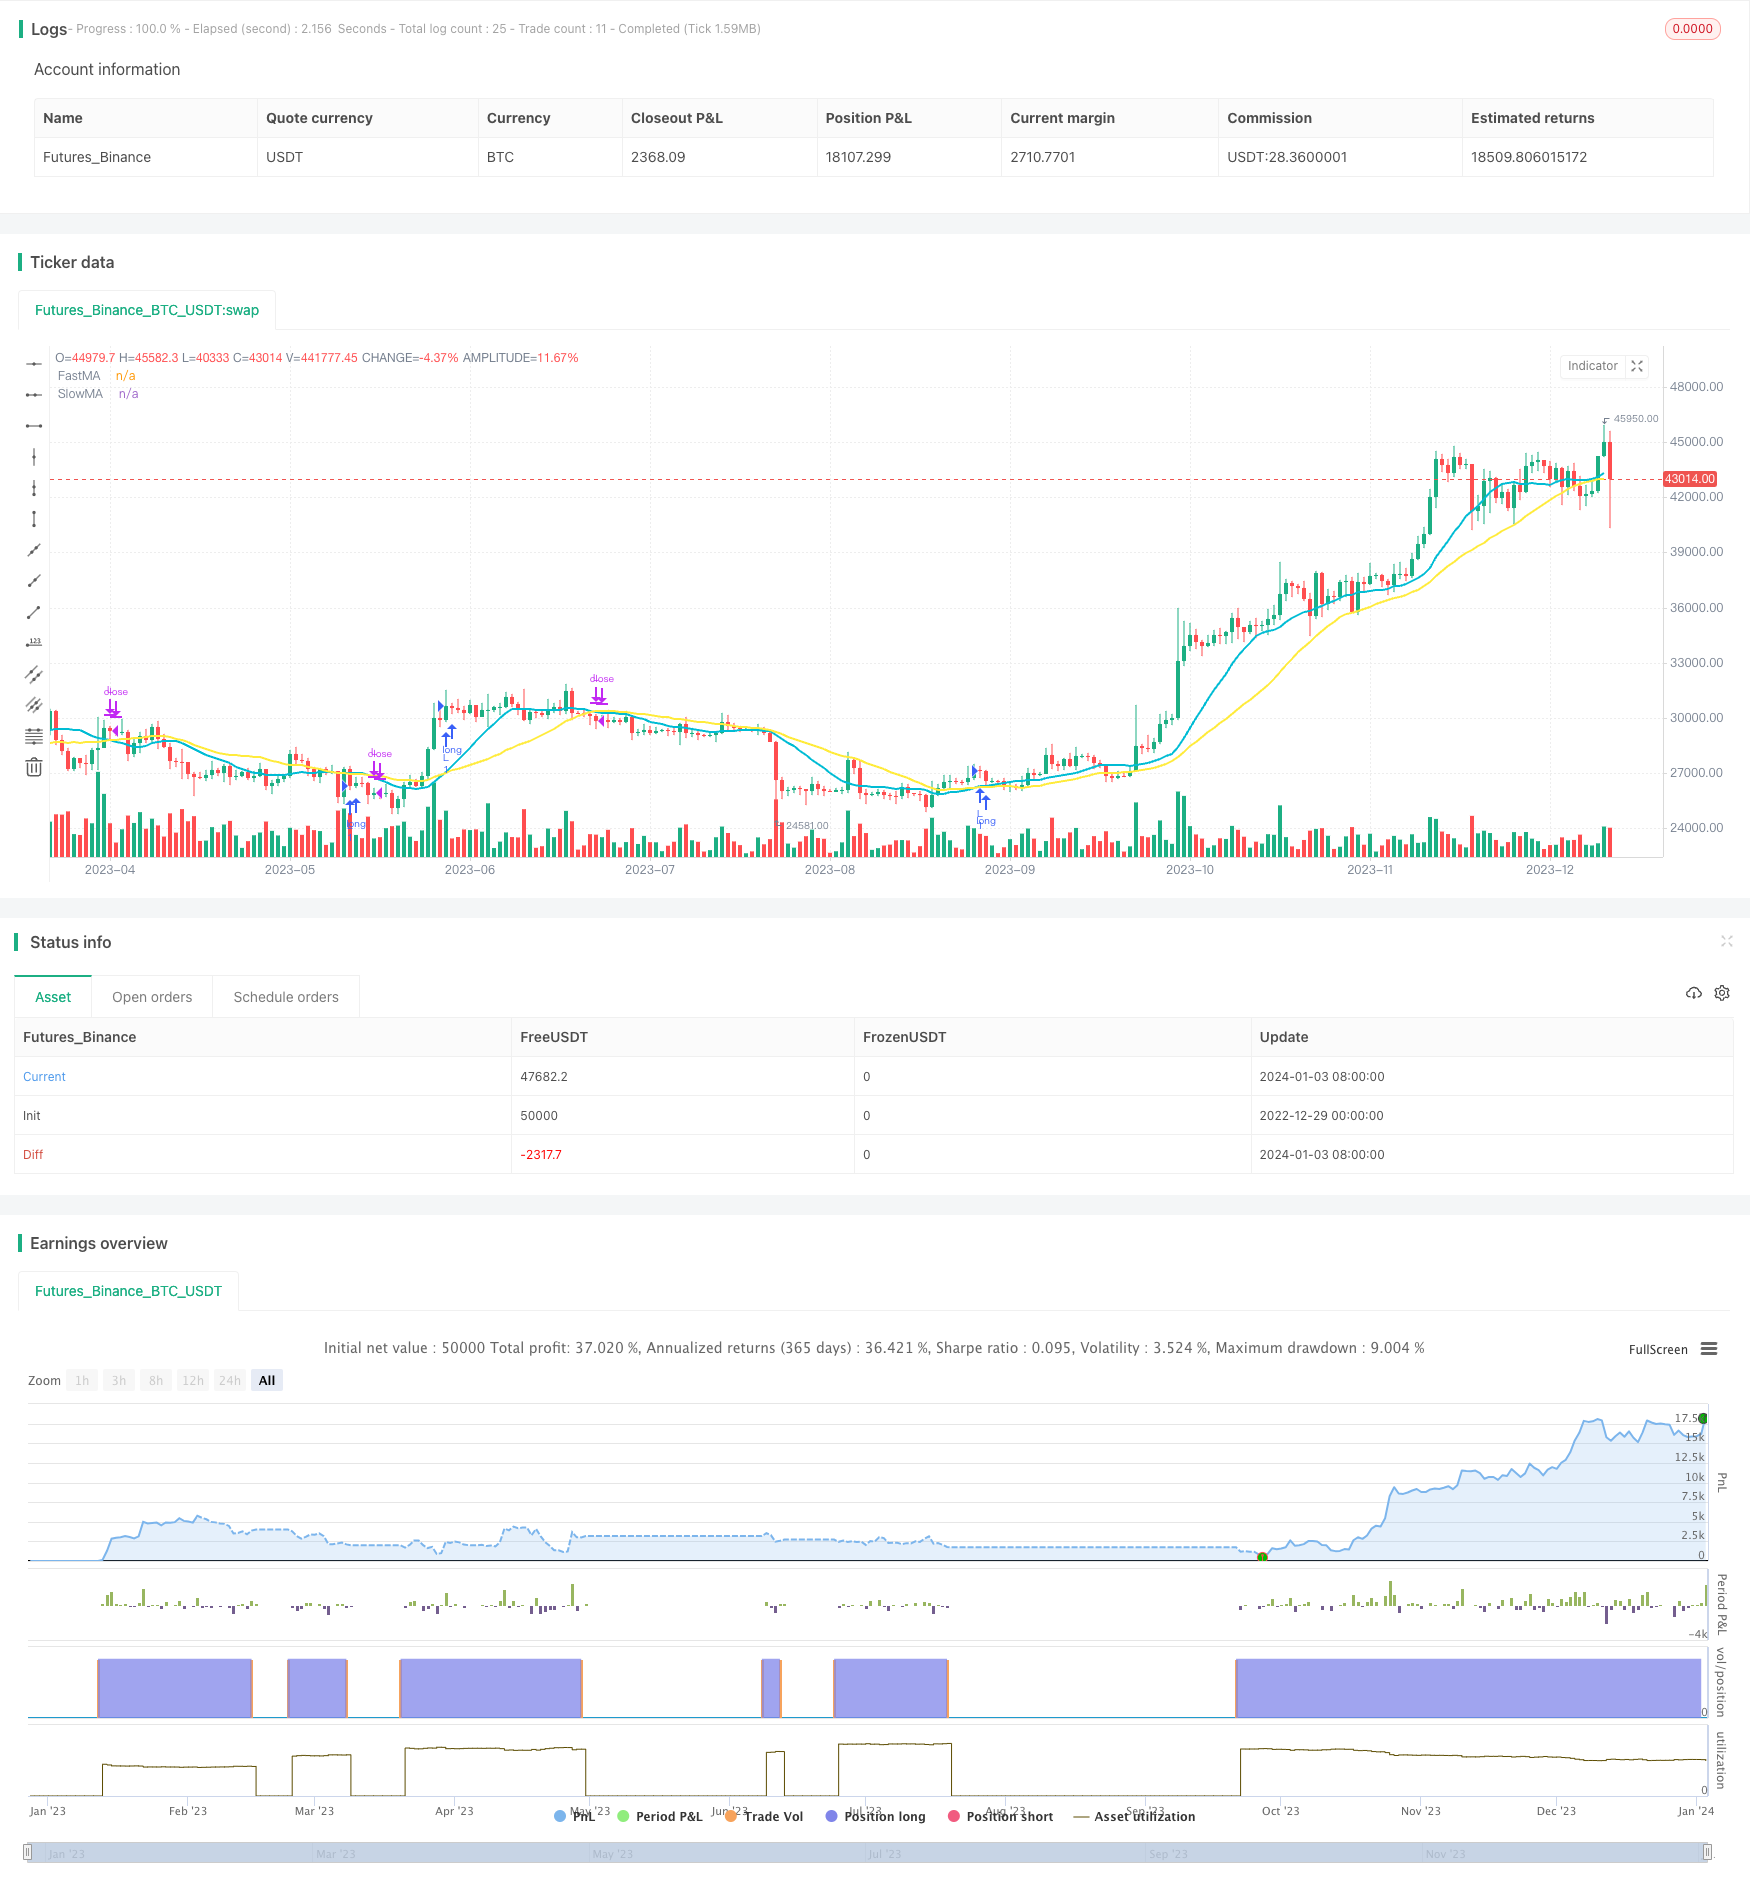
该策略的核心思想是实现一个可以灵活选择回测时间范围的框架,让用户可以根据不同的需求,自动或手动设置回测的起止时间。
策略通过输入参数提供了四种日期范围选择方式:使用全部历史数据、最近指定天数、最近指定周数或手动指定日期范围。策略会根据选择的日期范围动态设置回测窗口,而交易逻辑保持不变,这样可以比较不同时间窗口下策略表现的差异。
该策略由回测日期范围选择模块和双MA交易策略模块组成。
- 提供四种日期范围选择方式:全部历史数据(ALL)、最近指定天数(DAYS)、最近指定周数(WEEKS)、手动指定日期范围(MANUAL)。
- 根据选择的范围,通过时间戳转换动态设置回测起止时间。
- 使用时间条件window()函数过滤K线,仅在选择的日期范围内进行回测。
- 快速MA期间为fastMA,默认14;慢速MA期间为slowMA,默认28。
- 当快速MA上穿慢速MA时,做多;当快速MA下穿慢速MA时,平仓。
- 绘制快慢MA的曲线。
- 可以灵活选择不同的回测时间范围,没有限制,满足不同的实验需求。
- 可以在相同的时间范围内测试不同周期参数的效果,结果具有可比性。
- 修改交易逻辑简单,可以用作其他策略的框架。
- 双MA策略简单易懂,容易入门。
- 双MA策略较为粗糙,存在频繁买卖的问题。可以考虑加入止损机制等优化。
- 手动设置日期范围需要谨慎,避免使用错误的日期。可以显示提示信息。
- 全历史回测时间过长会增加测试周期。可以考虑增加滑点或手续费降低频繁交易。
- 增加止损逻辑判断,降低亏损的风险。
- 加入股票池过滤,优选指数相关性强的股票,提高稳定性。
- 增加交易信号的滤波器,过滤掉一定周期内不稳定的信号,减少不必要的交易。
- 测试不同分类指数相关股票的表现,找到最佳品种。
该策略作为一个通用的回测日期范围框架,优点是灵活、可定制,可以满足用户不同的测试需求。配合简单有效的双MA交易逻辑,可以快速对策略进行验证和比较。后续可通过增加过滤器、止损逻辑等进行优化,使策略向实盘应用又近了一步。总体来说,该策略框架具有很好的拓展性和参考价值。
||
The core idea of this strategy is to implement a framework that can flexibly select the backtest date range to meet different needs of users, so that they can automatically or manually set the start and end times for backtest.
The strategy provides four options for date range selection through input parameters: using all history data, recent specified days, recent specified weeks or manually specifying a date range. The strategy will dynamically set the backtest window based on the selected date range, while keeping the trading logic unchanged, so that the performance difference under different time windows can be compared.
The strategy consists of two modules: backtest date range selection and double MA trading strategy.
- Provides four options for date range selection: all history data (ALL), recent specified days (DAYS), recent specified weeks (WEEKS), manually specified date range (MANUAL).
- Dynamically sets the backtest start and end time based on timestamp conversion of the selected range.
- Uses time condition window() function to filter candles and only do backtest within selected date range.
- Fast MA period is fastMA, default 14; slow MA period is slowMA, default 28.
- Long when fast MA crosses over slow MA; close position when fast MA crosses below slow MA.
- Plots fast and slow MA curves.
- Flexibly selects different backtest date ranges without limitation to meet different experimental needs.
- Can test the effects of different period parameters within the same time frame with comparability of results.
- Easy to modify trading logic to serve as framework for other strategies.
- Simple to understand double MA strategy, easy for beginners.
- Double MA strategy is crude with frequent buying/selling issues. Consider adding stop loss etc. for optimization.
- Manually setting date range needs caution to avoid errors. Can show alert messages.
- Long history backtest increases test cycle. Can consider adding slippage or fees to reduce frequent trades.
- Add stop loss logic to lower risk of loss.
- Filter stocks with stocks pool by strong index relevance for higher stability.
- Add filters to remove unstable signals within certain periods to reduce unnecessary trades.
- Test performances of stocks indexes to find the best varieties.
As a flexible and customizable framework for date range selection, the advantages are meeting different test needs of users. Combined with simple but effective double MA trading logic, it can quickly verify and compare strategies. Follow-up optimizations like adding filters or stop loss logic can make the strategy more practical for live trading. In summary, the strategy framework has good scalability and reference value.
[/trans]
Strategy Arguments
| Argument | Default | Description |
|---|---|---|
| v_input_1 | 14 | FastMA |
| v_input_2 | 28 | SlowMA |
| v_input_3 | 0 | Date Range: WEEKS |
| v_input_4 | 52 | # Days or Weeks |
| v_input_5 | 9 | From Month |
| v_input_6 | 15 | From Day |
| v_input_7 | 2019 | From Year |
| v_input_8 | 12 | To Month |
| v_input_9 | 31 | To Day |
| v_input_10 | 9999 | To Year |
Source (PineScript)
/*backtest
start: 2022-12-29 00:00:00
end: 2024-01-04 00:00:00
period: 1d
basePeriod: 1h
exchanges: [{"eid":"Futures_Binance","currency":"BTC_USDT"}]
*/

//@version=4

strategy(title = "How To Auto Set Date Range", shorttitle = " ", overlay = true)

// Revision:        1
// Author:          @allanster

// === INPUT MA ===
fastMA = input(defval = 14, title = "FastMA", type = input.integer, minval = 1, step = 1)
slowMA = input(defval = 28, title = "SlowMA", type = input.integer, minval = 1, step = 1)

// === INPUT BACKTEST RANGE ===
useRange     = input(defval = "WEEKS", title = "Date Range", type = input.string, confirm = false, options = ["ALL", "DAYS", "WEEKS", "MANUAL"])
nDaysOrWeeks = input(defval = 52, title = "# Days or Weeks", type = input.integer, minval = 1)
FromMonth    = input(defval = 9, title = "From Month", minval = 1, maxval = 12)
FromDay      = input(defval = 15, title = "From Day", minval = 1, maxval = 31)
FromYear     = input(defval = 2019, title = "From Year", minval = 2014)
ToMonth      = input(defval = 12, title = "To Month", minval = 1, maxval = 12)
ToDay        = input(defval = 31, title = "To Day", minval = 1, maxval = 31)
ToYear       = input(defval = 9999, title = "To Year", minval = 2014)

// === FUNCTION EXAMPLE ===
window() => true

// === LOGIC ===
buy  = crossover(sma(close, fastMA), sma(close, slowMA))         // buy when fastMA crosses over slowMA
sell = crossunder(sma(close, fastMA), sma(close, slowMA))        // sell when fastMA crosses under slowMA

// === EXECUTION ===
strategy.entry("L", strategy.long, when=window() and buy)        // buy long when "within window of time" AND crossover
strategy.close("L", when=window() and sell)                      // sell long when "within window of time" AND crossunder

// === PLOTTING ===
plot(sma(close, fastMA), title = 'FastMA', color = color.aqua, linewidth = 2, style = plot.style_line)    // plot FastMA
plot(sma(close, slowMA), title = 'SlowMA', color = color.yellow, linewidth = 2, style = plot.style_line)  // plot SlowMA
Detail
https://www.fmz.com/strategy/437748
Last Modified
2024-01-05 12:12:10
