Name
基于动量震荡率优化策略Rate-of-Change-Optimization-Strategy
Author
ChaoZhang
Strategy Description
该策略是基于动量指标——变动速率(ROC)进行优化改进的策略。相比原始ROC策略,该策略进行了以下优化:
- 引入最大历史ROC值,当前ROC动态比较最大历史ROC,得到动量相对值。
- 对动量相对值进行平滑处理,生成信号。
- 加入买卖信号阈值。
通过这些优化手段,可以过滤掉许多无效信号,使策略更稳定可靠。
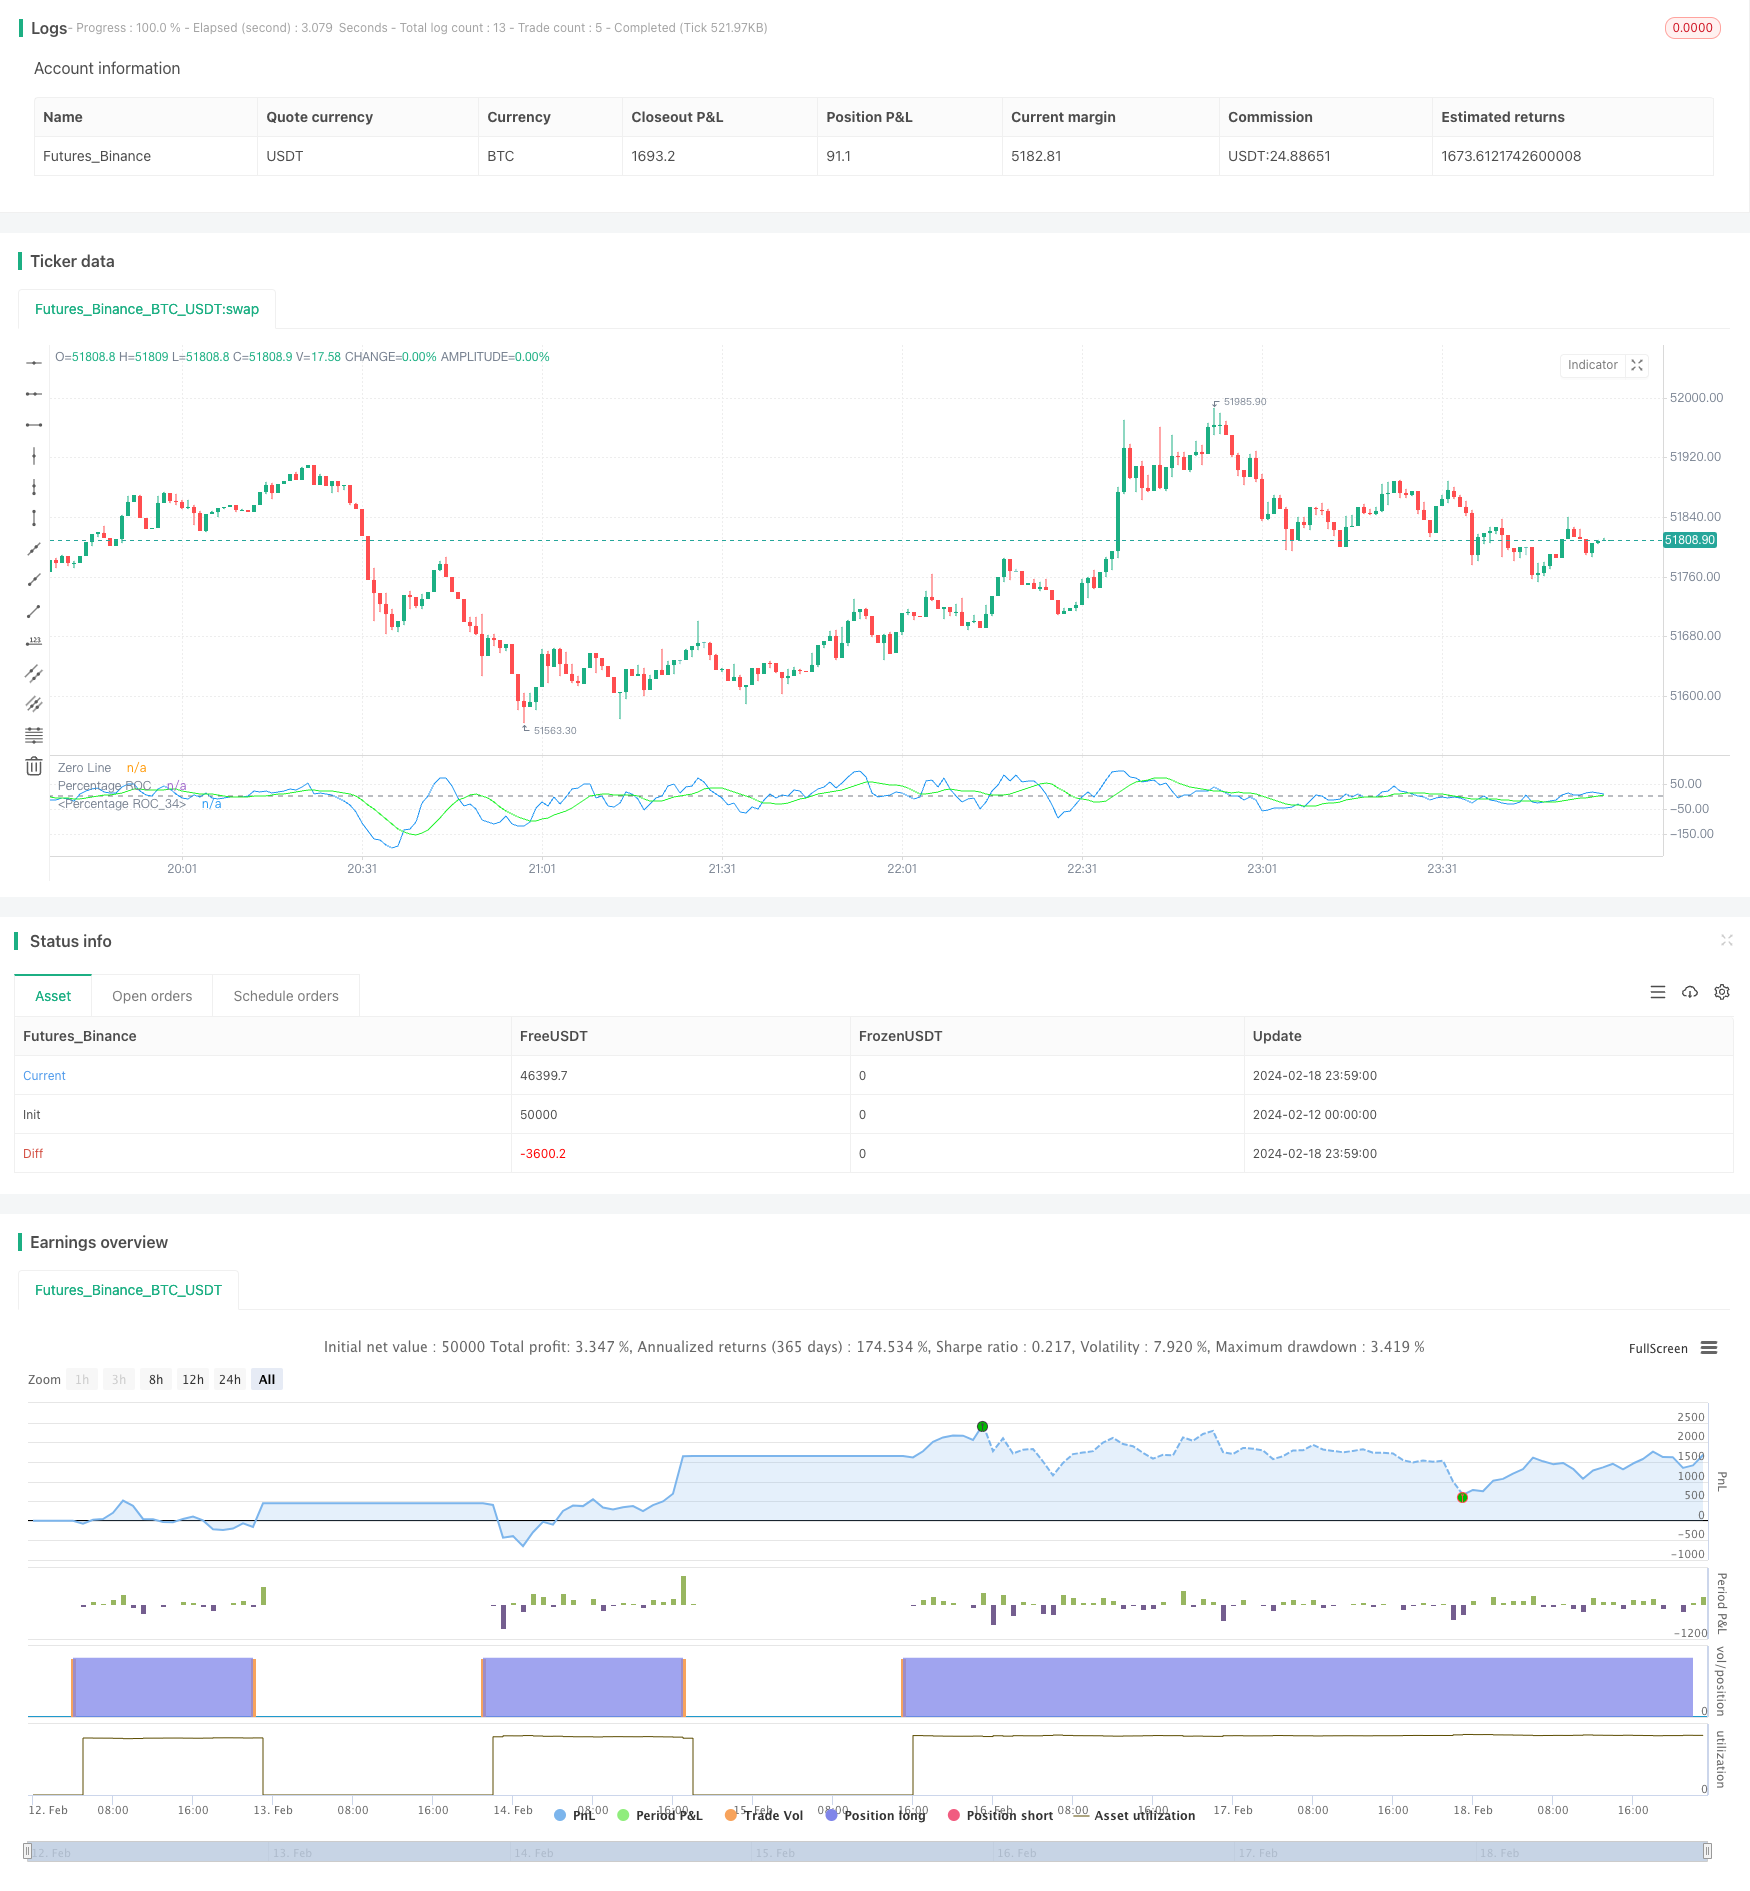
该策略的核心指标是变动速率(ROC)。ROC衡量股票价格在一定周期内的变化速率。该策略首先计算长度为9周期的ROC值。然后它会记录这个ROC指标在过去200周期内的最大值,并计算当前ROC占最大历史ROC的百分比,得到动量的相对强度。例如,如果过去200天里,ROC最高达到过100,那么当天的ROC为80时,相对强度就是80%。
该相对强度通过长度10的SMA进行平滑处理,过滤掉短期波动,得到平滑曲线。当平滑曲线连续3天上涨,并且值低于-80%时,认为股价跌幅开始放缓,产生底部迹象,因此做多;当平滑曲线连续3天下跌,并且值高于80%时,认为股价涨幅开始放缓,产生顶部迹象,因此平仓。
该策略相比原始ROC策略,主要有以下优势:
- 引入历史ROC最大值比较,可以很好地衡量动量指标的相对高度,过滤掉绝对值并不高的无效信号。
- 平滑处理过滤噪音,使信号更稳定可靠。
- 设定买卖阈值,减少无效交易。
总的来说,该策略对ROC指标进行了有效的二次加工,使其更适合实盘交易。
该策略主要存在以下风险:
- ROC指标无法确定市场趋势,存在一定的误导。如果遇到牛熊转换时期,该策略可能失败。
- 买卖阈值并非完美,阈值设置得过高或过低都会影响策略表现。
- SMA参数设置不当也会影响策略效果。
为降低上述风险,可以考虑结合趋势指标,判断大趋势;调整阈值参数,测试最优参数;优化SMA周期参数。
该策略可以从以下方向进行优化:
- 结合趋势指标,判断市场总体走势,避免在牛熊转换时失效。
- 测试不同的ROC长度参数和买卖阈值参数,寻找最优参数组合。
- 对SMA平滑参数进行优化,找到最佳参数。
- 增加止损机制。
该策略是在ROC指标基础上进行 secondary development 的优化策略。它引入历史最大值比较、SMA 平滑和买卖阈值等手段,可以过滤无效信号,使策略更稳定。主要优点是信号质量高,适合实盘。后续可从结合趋势、参数优化等方面进行改进,从而进一步提高策略表现。
||
This strategy optimizes the original Rate of Change (ROC) strategy. Compared with the original ROC strategy, this strategy has the following optimizations:
- Introduce the maximum historical ROC value for dynamic comparison with the current ROC to obtain relative momentum value.
- Smooth the relative momentum value to generate signals.
- Add buy and sell signal thresholds.
Through these optimization measures, many invalid signals can be filtered out to make the strategy more stable and reliable.
The core indicator of this strategy is Rate of Change (ROC). ROC measures the rate of change in stock prices over a certain period. This strategy first calculates the ROC value over a period of 9. Then it records the maximum value of this ROC indicator in the past 200 periods and calculates the current ROC as a percentage of the maximum historical ROC to obtain the relative strength of momentum. For example, if the highest ROC in the past 200 days reached 100, then the relative strength is 80% when today's ROC is 80.
The relative strength is smoothed by a 10-period SMA to filter out short-term fluctuations and obtain a smooth curve. When the smooth curve rises continuously for 3 days and the value is below -80%, it is considered that the stock price decline begins to slow down and the bottom sign appears, so go long; when the smooth curve falls continuously for 3 days and the value is above 80%, it is considered that the stock price increase begins to slow down and the top sign appears, so close position.
Compared with the original ROC strategy, this strategy has the following main advantages:
- Introducing historical maximum ROC value comparison can effectively measure the relative level of momentum indicators and filter out invalid signals with absolute values that are not high enough.
- Smoothing processing filters noise and makes signals more stable and reliable.
- Setting buy and sell thresholds reduces invalid transactions.
In general, this strategy effectively processes the ROC indicator to make it more suitable for live trading.
The main risks of this strategy are:
- The ROC indicator cannot determine market trends and there are some misleadings. The strategy may fail when it encounters a bull-bear transition period.
- Buy and sell thresholds are not perfect. Setting the thresholds too high or too low will affect strategy performance.
- Improper SMA parameter settings will also affect strategy results.
To reduce the above risks, consider combining trend indicators to determine major trends; adjust threshold parameters and test optimal parameters; optimize SMA cycle parameters.
The strategy can be optimized in the following ways:
- Combine trend indicators to determine overall market direction and avoid failure during bull-bear conversion.
- Test ROC length parameters and buy and sell threshold parameters to find optimal parameter combinations.
- Optimize SMA smoothing parameters to find the best parameters.
- Increase stop loss mechanism.
This is an optimization strategy based on secondary development of the ROC indicator. It introduces means such as historical maximum value comparison, SMA smoothing, and buy and sell thresholds to filter out invalid signals and make the strategy more stable. The main advantage is the high signal quality which is suitable for live trading. Follow-up improvements can be made from combining trends, parameter optimization and so on to further improve strategy performance.
[/trans]
Strategy Arguments
| Argument | Default | Description |
|---|---|---|
| v_input_int_1 | 9 | Length |
| v_input_1 | 200 | Max Historical Period for ROC |
| v_input_int_2 | 10 | Length Smoothed ROC |
| v_input_int_3 | -80 | Buy Threshold |
| v_input_int_4 | 80 | Buy Threshold |
Source (PineScript)
/*backtest
start: 2024-02-12 00:00:00
end: 2024-02-19 00:00:00
period: 1m
basePeriod: 1m
exchanges: [{"eid":"Futures_Binance","currency":"BTC_USDT"}]
*/

//@version=5
strategy(title="Rate Of Change Mod Strategy", shorttitle="ROC", format=format.price, precision=2)
//length = input.int(9, minval=1)
//source = input(close, "Source")
//roc = 100 * (source - source[length])/source[length]
//plot(roc, color=#2962FF, title="ROC")
//hline(0, color=#787B86, title="Zero Line")

length = input.int(9, minval=1, title="Length")
maxHistory = input(200, title="Max Historical Period for ROC")
lenghtSmooth = input.int(10, minval=1, title="Length Smoothed ROC")
lenghtBUY = input.int(-80, title="Buy Threshold")
lenghtSELL = input.int(80, title="Buy Threshold")

source = close
roc = 100 * (source - source[length]) / source[length]

// Calculate the maximum ROC value in the historical period
maxRoc = ta.highest(roc, maxHistory)

// Calculate current ROC as a percentage of the maximum historical ROC
rocPercentage = (roc / maxRoc) * 100


rocPercentageS = ta.sma(rocPercentage, lenghtSmooth)
if ta.rising(rocPercentageS, 3) and rocPercentageS < lenghtBUY
    strategy.entry("Buy", strategy.long)

if ta.falling(rocPercentageS, 3) and rocPercentageS > lenghtSELL
    strategy.close("Buy")


plot(rocPercentage, color=color.new(color.blue, 0), title="Percentage ROC")
plot(rocPercentageS, color=color.new(#21f32c, 0), title="Percentage ROC")
hline(0, color=color.new(color.gray, 0), title="Zero Line")
Detail
https://www.fmz.com/strategy/442221
Last Modified
2024-02-20 13:54:49
