Name
基于一目均衡表的趋势追踪策略-Momentum-Tracking-Strategy-Based-on-Ichimoku-Cloud
Author
ChaoZhang
Strategy Description
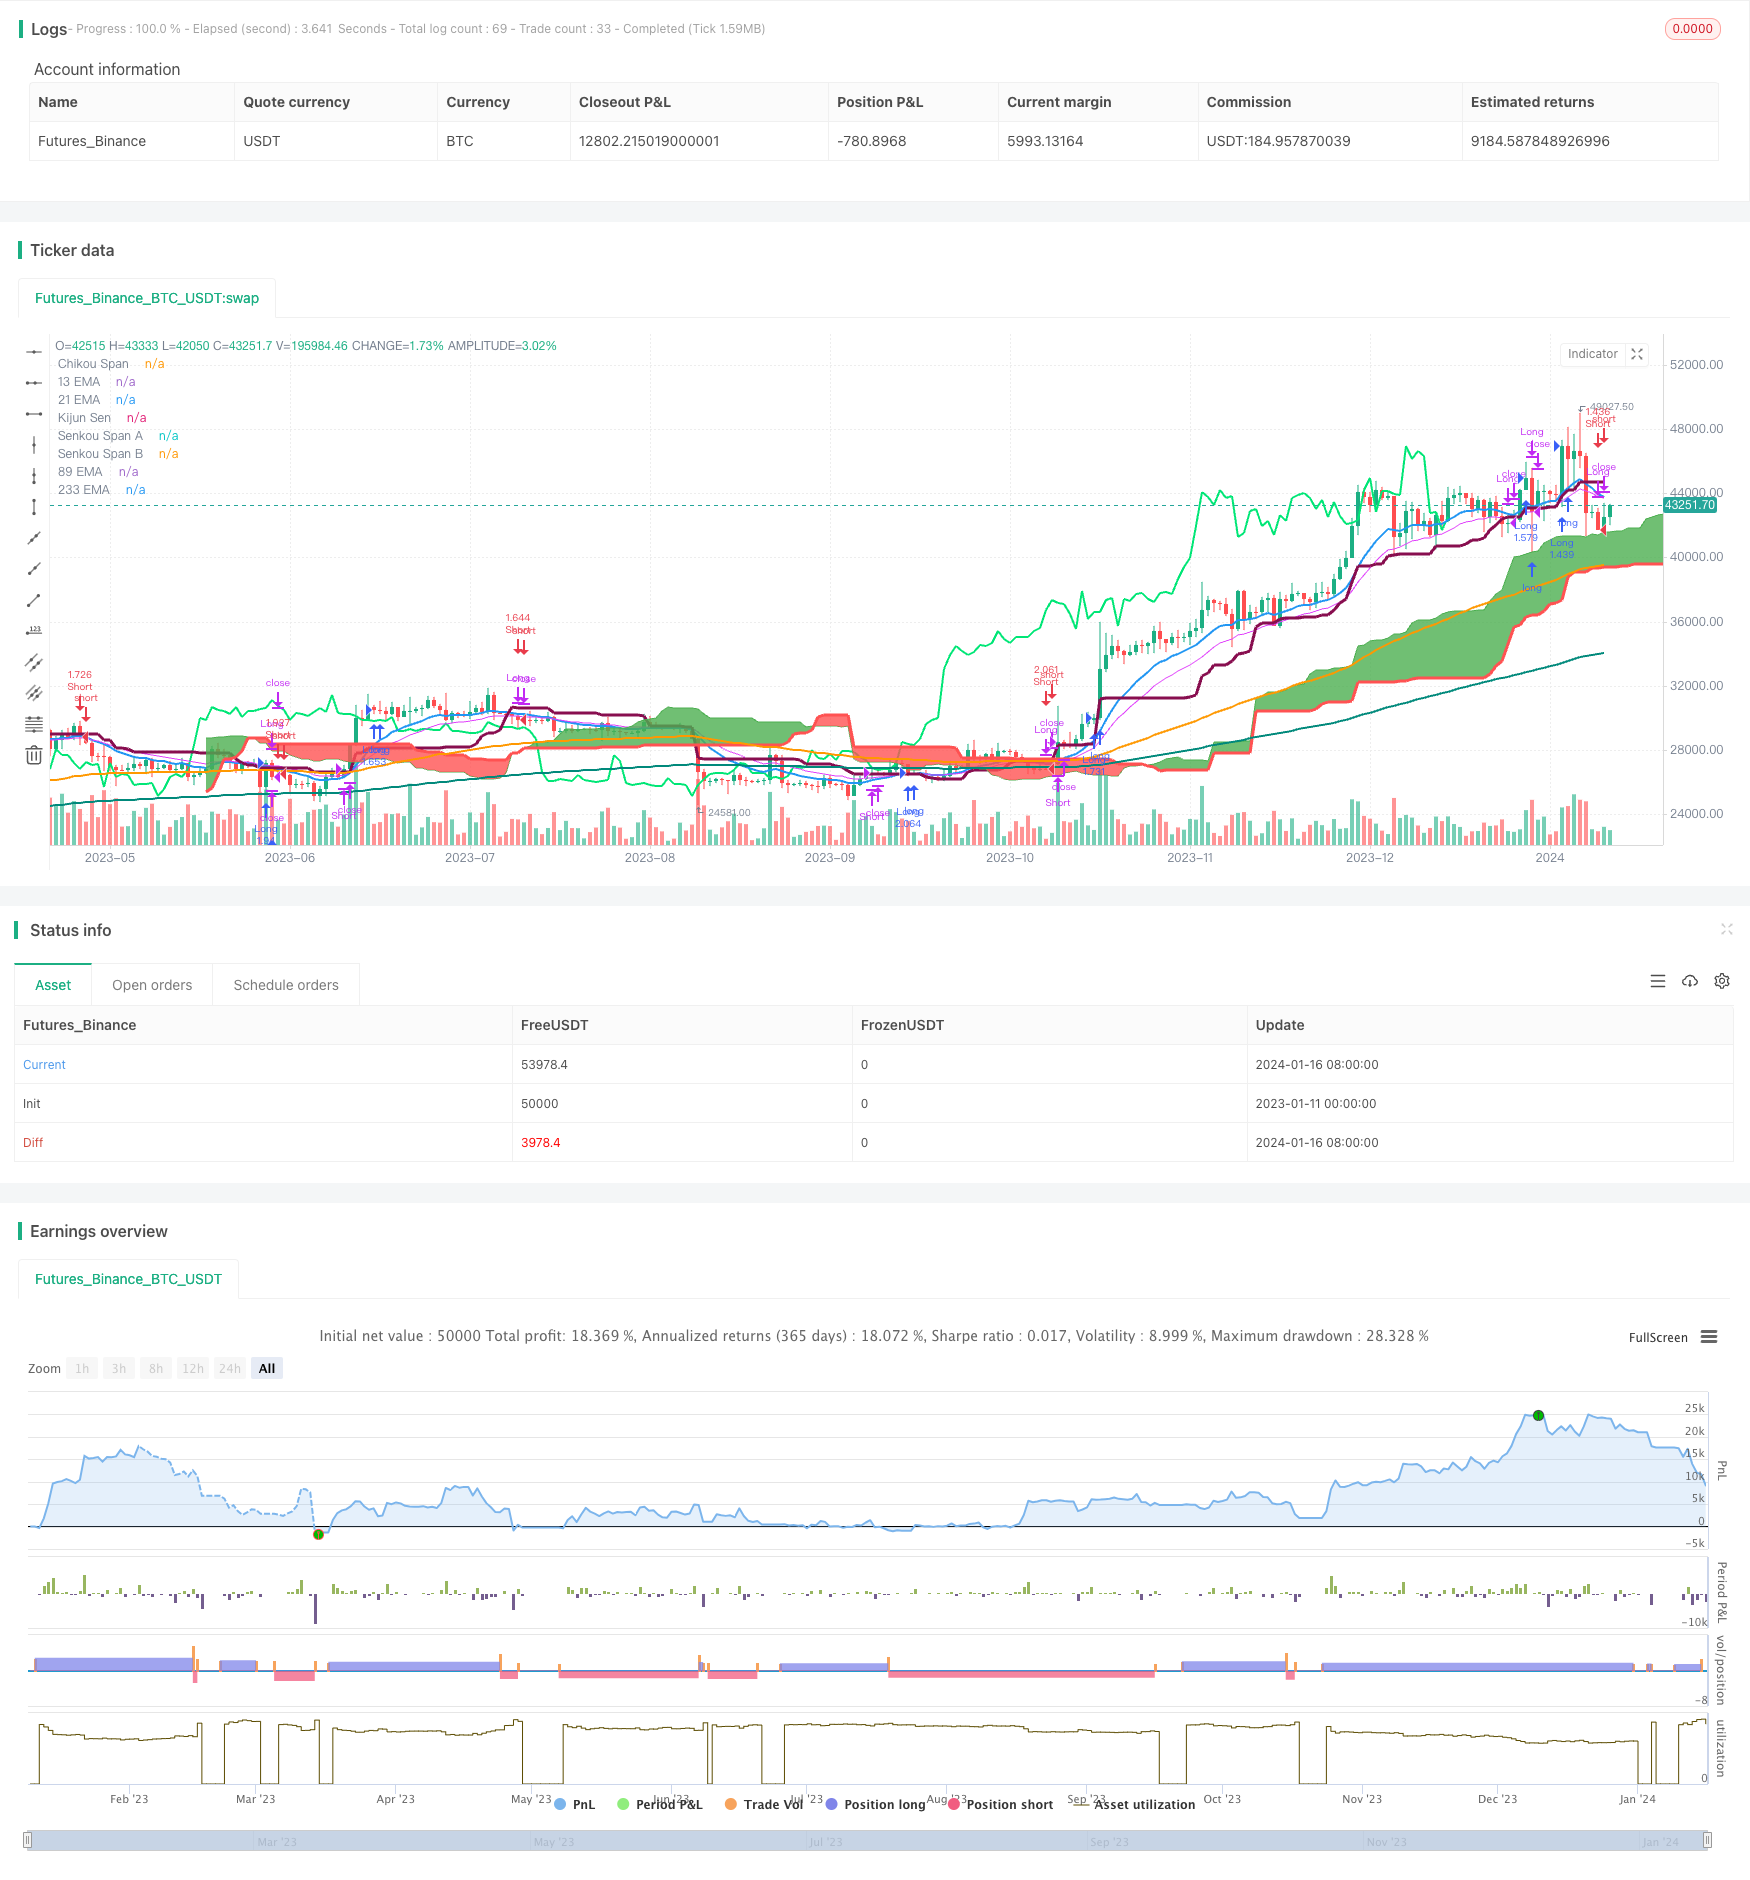
本策略结合了移动平均线、相对强弱指标(RSI)以及一目均衡表指标,目标是识别股票价格的趋势,并在趋势背景下进行交易。核心思路是当短期平均线上穿中长期平均线,并在一目均衡表的云团上方突破时,产生买入信号;当短期平均线下穿中长期平均线,并在云团下方突破时,产生卖出信号。
本策略使用13日、21日、89日和233日四条移动平均线。13日线代表短期趋势,233日线代表长期趋势,21日线和89日线在中期。当短期平均线上穿中长期平均线时,表示股价走势由跌转涨,产生买入信号。反之,短期平均线下穿中长期平均线则为卖出信号。
此外,本策略还结合一目均衡表指标中的转换线、基准线和前沿线。转换线采用9日移动平均值,基准线采用26日移动平均值,前沿线则采用中短期移动平均值。当价格上穿前沿线时为买入信号,下穿为卖出信号。
最后,策略还采用RSI指标中的12日线和24日线。12日线代表短期为超买超卖情况,24日线代表中期的超买超卖情况。策略通过判断12日RSI线与24日RSI线的交叉情况来确认交易信号。
- 结合移动平均线识别趋势方向
- 一目均衡表判断进入和退出的时机
- RSI指标避免虚假突破
本策略能够非常好地识别股票价格的主要趋势方向。移动平均线结合一目均衡表指标,使买入卖出信号更加准确。此外,RSI指标的引入也避免了可能的虚假突破情况。总的来说,本策略集多个指标优势于一身,可以有效锁定主要趋势,从中获利。
-
趋势反转风险
交易者需要密切关注行情变化,一旦出现价格触碰平均线的迹象就要提高警惕,及时平仓。 -
参数优化空间
移动平均线的周期设置、一目均衡表参数等都有优化的空间,交易者可以根据不同品种选择最优参数组合。 -
交易频率偏高
策略的交易频率会比较高,需要充分考量手续费的问题。可以适当调整参数,减少不必要的交易。
-
增加止损止盈策略
目前策略没有设置止损止盈逻辑,这会带来一定的风险。后期可以考虑在策略中加入此类模块。 -
参数优化
针对不同的交易品种,可以对移动平均线周期、一目均衡表参数、RSI周期等进行优化,找到最佳的组合。这可以进一步提高策略的稳定性。 -
结合更多指标
除了已使用的指标,还可以考虑结合波动率、交易量变化等其他衍生指标,形成更全面的判断依据。
本策略结合移动平均线、相对强弱指标和一目均衡表指标,可以有效识别证券价格的主要趋势,属于比较典型的趋势跟踪策略。策略的优势在于指标组合全面,可以很好地把握趋势;但交易频率较高,也存在一定程度的回撤风险。通过引入止损止盈、参数优化等手段,本策略的效果还有提升的空间。总体而言,本策略是一种稳定、可靠的趋势策略,适合那些有一定风险承受能力并希望持续获利的投资者。
||
This strategy combines moving averages, relative strength index (RSI) and ichimoku cloud to identify price trends and make trades accordingly. The core idea is to generate buy signals when the short term moving average crosses above the medium term average and penetrates above the cloud, and to generate sell signals when the reverse happens.
The strategy employs four moving averages - 13, 21, 89 and 233 days. The 13 day MA represents short term trend while the 233 day line shows long term trend. The 21 and 89 day MAs are in between. When the short term MA crosses above the medium term ones, it indicates an upside breakout and generates buy signals. The opposite cross leads to sell signals.
In addition, the conversion line (9 day MA), base line (26 day MA) and leading span (average of conversion and base lines) of the Ichimoku cloud are used. Penetrating above the leading span gives buy signals while breaking below it shows sells.
Furthermore, 12 and 24 day RSIs are applied. The 12 day RSI represents short term overbought/oversold levels while the 24 day line shows medium term situations. Crossovers between the two can help confirm trading signals.
- Identify trend direction with MAs
- Ichimoku cloud for entry and exit timing
- Avoid false breakouts using RSI
This strategy excels at capturing the prevailing trend of security prices. Entry and exit based on MAs and ichimoku improves precision. Moreover, RSI crossover helps avoid false signals. In summary, this combines strengths of multiple indicators to effectively trade along the trend.
-
Trend reversal risk
Traders should watch out for prices touching moving averages and get ready to close positions. -
Parameter optimization
There are rooms to improve MA periods, Ichimoku parameters etc. Traders can experiment to find the optimal set for different products. -
High trading frequency
The strategy may trade quite frequently, thus commission costs need to be considered. Fine tuning parameters can help reduce unnecessary trades.
-
Add stop loss/profit target
Introducing such risk management mechanisms would reduce drawdowns. -
Parameter tuning
Optimize MA periods, Ichimoku inputs, RSI days etc for better stability across different products. -
Incorporate more indicators
Other derived indicators around volatility and volume could provide additional insight.
This is a typical trend following strategy harnessing strengths of MAs, RSI and Ichimoku cloud. It reliably locks onto prevailing trends. Through refinements like stop loss, parameter optimization etc, performance can be further improved. Overall this is a stable, profitable momentum strategy suitable for investors with adequate risk appetite seeking persistent gains.
[/trans]
Strategy Arguments
| Argument | Default | Description |
|---|---|---|
| v_input_1 | 9 | Tenkan Sen Periods |
| v_input_2 | 26 | Kijun Sen Periods |
| v_input_3 | 52 | Senkou Span B Periods |
| v_input_4 | 26 | Displacement |
Source (PineScript)
/*backtest
start: 2023-01-11 00:00:00
end: 2024-01-17 00:00:00
period: 1d
basePeriod: 1h
exchanges: [{"eid":"Futures_Binance","currency":"BTC_USDT"}]
*/

//@version=3

strategy("EMA + Ichimoku Kinko Hyo Strategy", shorttitle="EMI", overlay=true, default_qty_type=strategy.percent_of_equity, max_bars_back=1000, default_qty_value=100, calc_on_order_fills= true, calc_on_every_tick=true, pyramiding=0)

TenkanSenPeriods = input(9, minval=1, title="Tenkan Sen Periods")
KijunSenPeriods = input(26, minval=1, title="Kijun Sen Periods")
SenkouSpanBPeriods = input(52, minval=1, title="Senkou Span B Periods")
displacement = input(26, minval=1, title="Displacement")
donchian(len) => avg(lowest(len), highest(len))
TenkanSen = donchian(TenkanSenPeriods)
KijunSen = donchian(KijunSenPeriods)
SenkouSpanA = avg(TenkanSen, KijunSen)
SenkouSpanB = donchian(SenkouSpanBPeriods)
SenkouSpanH = max(SenkouSpanA[displacement - 1], SenkouSpanB[displacement - 1])
SenkouSpanL = min(SenkouSpanA[displacement - 1], SenkouSpanB[displacement - 1])
ChikouSpan = close[displacement-1]

Sema = ema(close, 13)
Mema = ema(close, 21)
Lema = ema(close, 89)
XLema = ema(close, 233)

plot(Sema, color=blue, title="13 EMA", linewidth = 2)
plot(Mema, color=fuchsia, title="21 EMA", linewidth = 1)
plot(Lema, color=orange, title="89 EMA", linewidth = 2)
plot(XLema, color=teal, title="233 EMA", linewidth = 2)
plot(KijunSen, color=maroon, title="Kijun Sen", linewidth = 3)
plot(close, offset = -displacement, color=lime, title="Chikou Span", linewidth = 2)
sa=plot (SenkouSpanA, offset = displacement, color=green,  title="Senkou Span A", linewidth = 1)
sb=plot (SenkouSpanB, offset = displacement, color=red,  title="Senkou Span B", linewidth = 3)
fill(sa, sb, color = SenkouSpanA > SenkouSpanB ? green : red)

longCondition = (rsi(close, 12)>rsi(close, 24)) and close>ChikouSpan and Sema>KijunSen
strategy.entry("Long",strategy.long,when = longCondition)

strategy.close("Long", when = (rsi(close, 12)<rsi(close, 24) and (close<KijunSen and close<ChikouSpan)))

shortCondition = (rsi(close, 12)<rsi(close, 24)) and close<ChikouSpan and Sema<KijunSen
strategy.entry("Short",strategy.short, when = shortCondition)

strategy.close("Short", when = (rsi(close, 12)>rsi(close, 24) and (close>KijunSen and close>ChikouSpan)))
Detail
https://www.fmz.com/strategy/439206
Last Modified
2024-01-18 12:32:46
