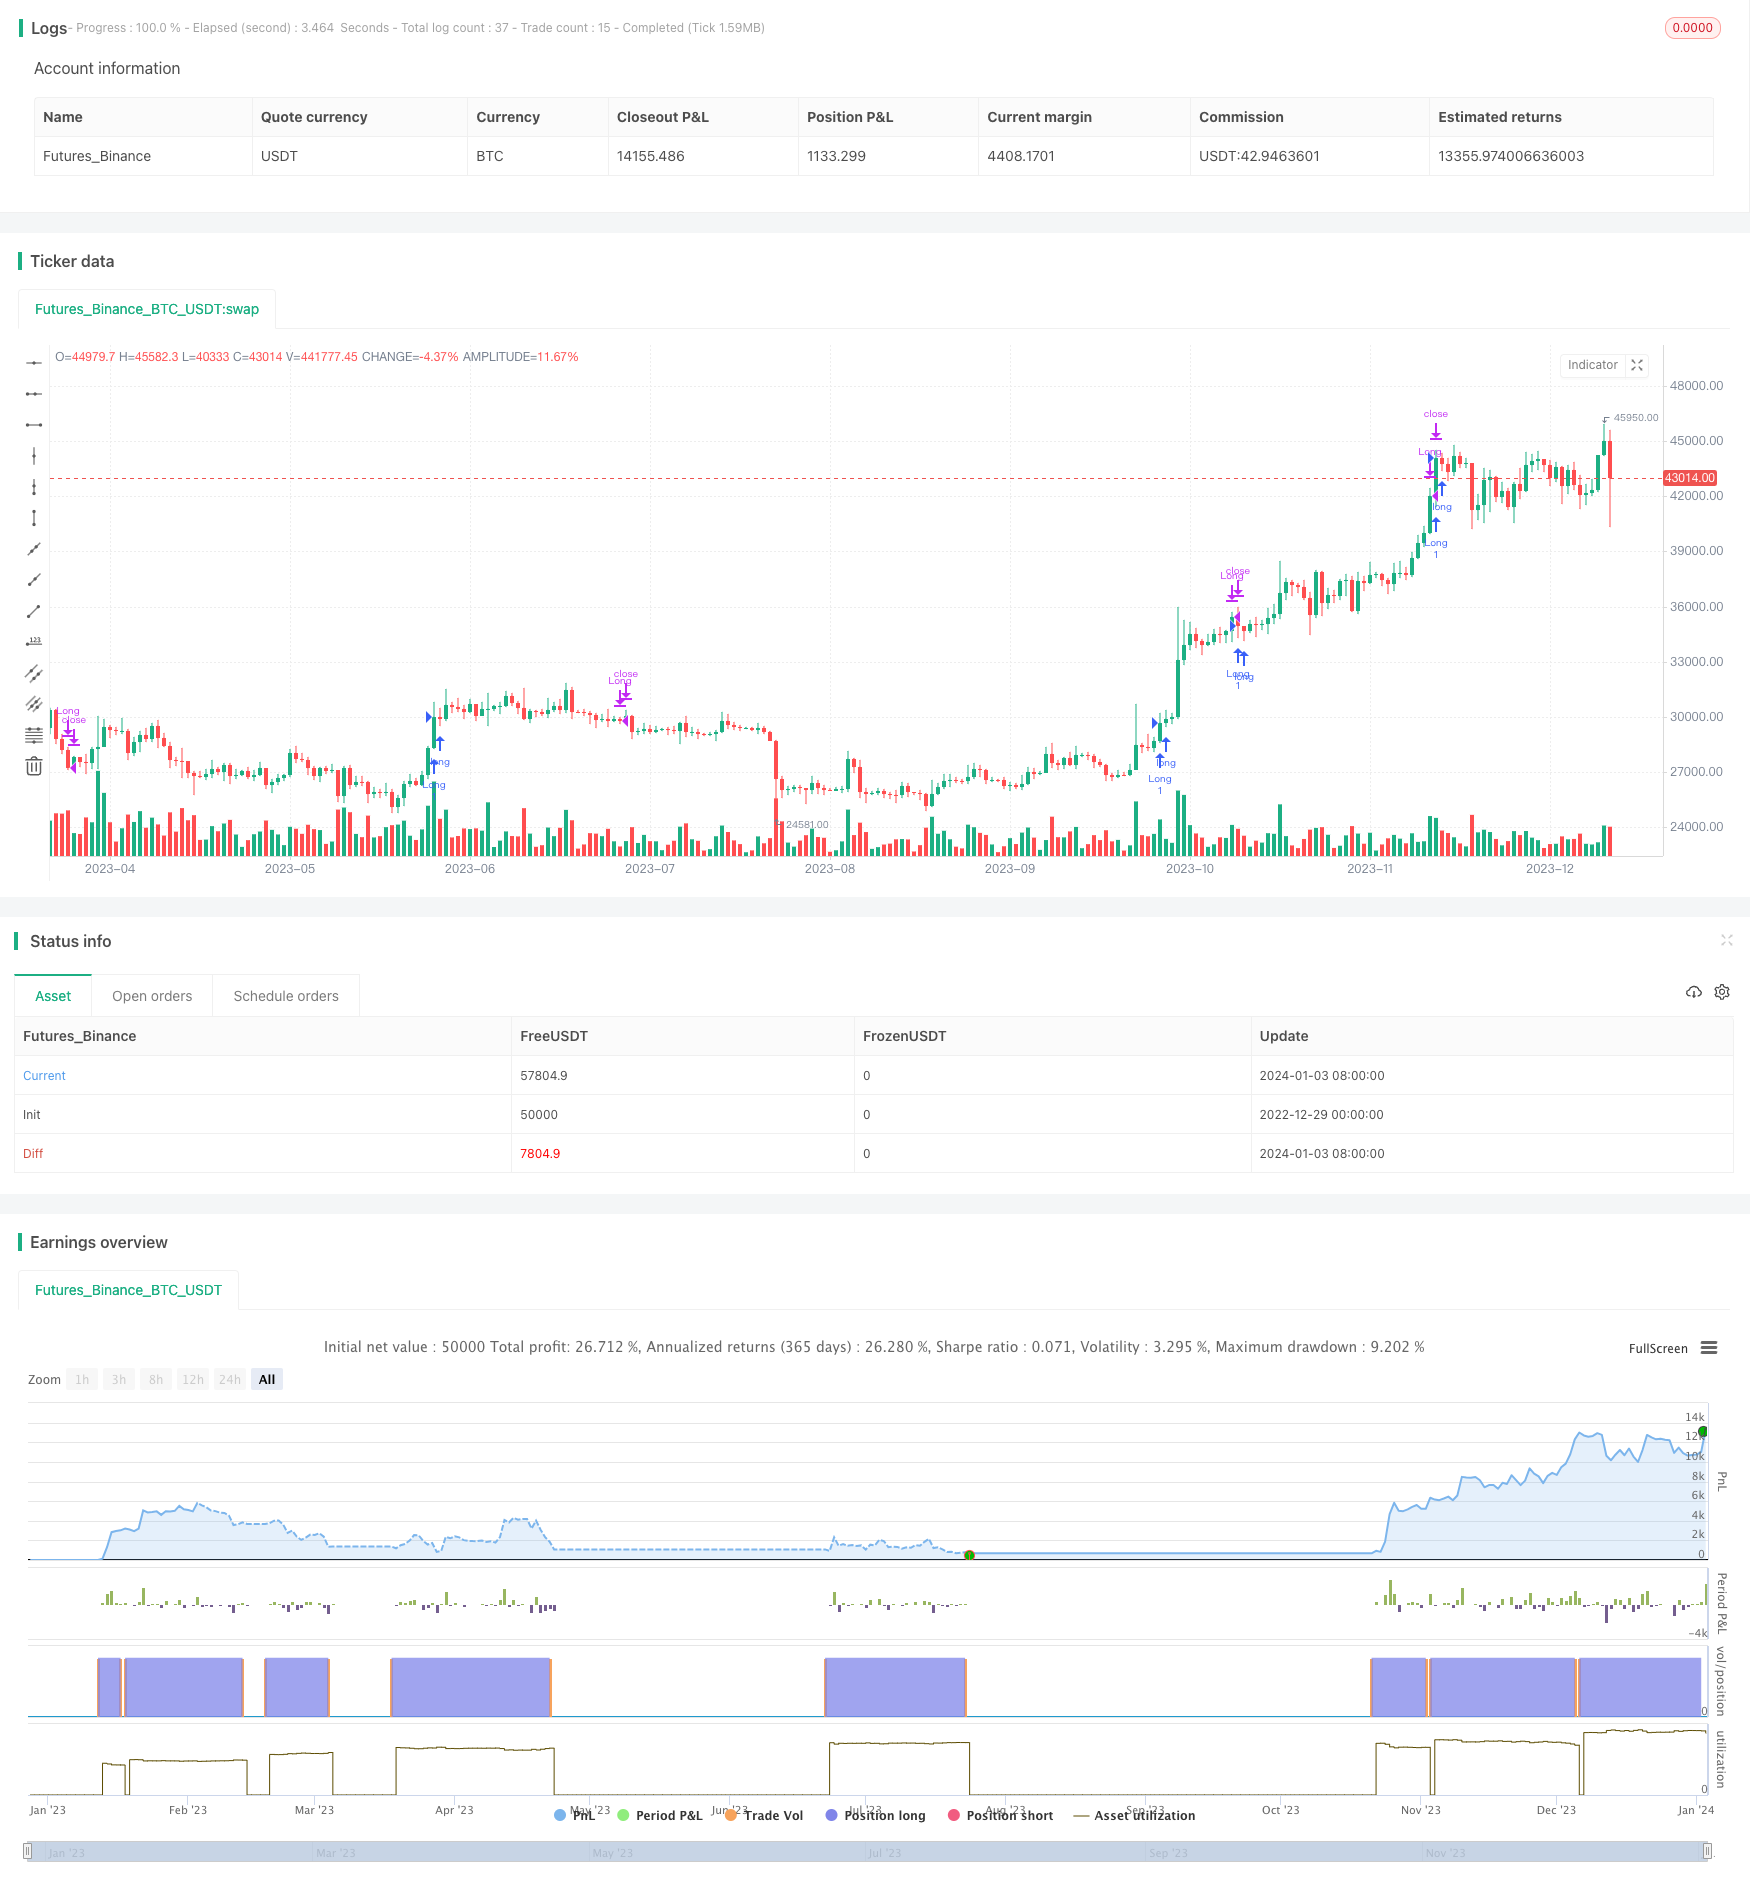
Name
均线黄金交叉RSI-MACD策略Improved-RSI-MACD-Moving-Average-Strategy
Author
ChaoZhang
Strategy Description
该策略是一个利用RSI、MACD和移动平均线的组合策略。它在判断入市时点时融合了RSI的超买超卖信号、MACD的敏感性和移动平均线的指标效应。
该策略主要判断以下四个条件来决定做多入市:
- MACD的柱线大于设置的多头进入参数;
- RSI大于50,表示处于超买状态;
- 短期EMA上穿长期EMA,形成黄金交叉;
- 收盘价上穿长期EMA,并且高于长期EMA加上ATR止损幅度。
当以下两个出场条件成立时,策略会平仓止损:
- MACD的柱线小于设置的止损参数;
- 短期EMA下破长期EMA成死叉。
这样,策略在盈利回撤时及时止损,避免出现较大亏损。
该策略最大的优势在于指标的组合使用,发挥了各个指标的优势,具体来说:
- RSI的应用避免了在震荡行情中反复开仓带来的交易费用损耗。
- MACD柱形指标的灵敏度确保了及时捕捉到行情转折点。
- 移动平均线过滤了短线市场噪音,发挥其指标效应。
该策略主要存在以下两方面的风险:
-
回撤风险较大。移动平均线等趋势型策略最大的风险在于行情反转带来的较大回撤。可通过降低仓位规模、止损设置来积极控制回撤。
-
参数优化难度大。多指标组合策略参数设置与优化难度都较大。可采用步进法、遗传算法等参数优化方法来确定最优参数。
该策略可从以下几个方面继续优化:
-
增加附加条件,进一步过滤假信号。例如结合交易量指标、波动率指标等。
-
测试不同品种参数设置差异。调整参数适应更多品种。
-
优化移动平均线参数设置。测试不同长度参数的差异。
-
研究采用自适应移动平均线。根据市场环境switch不同参数组合。
本策略总体来说是一个典型的优化版移动平均线与趋势跟踪策略。它吸收了MACD、RSI等多个主流指标的优点,在判断入市时机和止损方面都有独到之处。下一步,可从参数优化、风险控制等多方面进行改进,使策略参数更加鲁棒、符合更多品种,从而获得更高的稳定性。
||
This is a combination strategy utilizing RSI, MACD and Moving Averages. It incorporates the overbought/oversold signals from RSI, the sensitivity of MACD and the indicator effect of moving averages when determining entry points.
The strategy mainly judges the following four conditions to decide long entry:
- MACD histogram is greater than the set long entry level;
- RSI is above 50, indicating overbought state;
- Short period EMA crosses above long period EMA, forming golden cross;
- Close price breaks through long period EMA and is higher than long period EMA plus ATR stop loss range.
When the following two exit conditions are met, the strategy will close positions to stop loss:
- MACD histogram is less than the set stop loss level;
- Short period EMA crosses below long period EMA, forming dead cross.
Thus the strategy timely stops loss and avoids huge losses when profit taking or retracement.
The biggest advantage of this strategy lies in the combination use of indicators, giving full play to the merits of each indicator:
-
The application of RSI avoids the transaction fee loss caused by repeatedly opening positions in range-bound markets.
-
The sensitivity of MACD histogram indicator ensures timely capture of inflection points.
-
Moving averages filter out short-term market noise and give full play to indicator effect.
The main risks of this strategy include:
-
High retracement risk. The biggest risk of moving average like trend following strategies is large pullback caused by trend reversal. This can be actively controlled by means of position sizing, stop loss etc.
-
Difficulty in parameter optimization. Multi-indicator combined strategies have higher difficulty in parameter setting and optimization. Methods like walk forward, genetic algorithm can be adopted for optimized parameters.
The strategy can be further optimized in the following aspects:
-
Increase additional filters to further avoid false signals, e.g. combine with volume, volatility indicators etc.
-
Test parameter differences fitting more products. Adjust parameters to adapt more varieties.
-
Optimize moving average parameter settings. Test the differences of various length parameters.
-
Research adaptive moving averages. Switch different parameter sets based on market regimes.
In conclusion, this strategy is a typical optimized version of moving average and trend following strategy. It absorbs the strengths of mainstream indicators like MACD and RSI in aspects of timing entry and stopping loss. Next steps could be improving from perspectives like parameter optimization and risk control to make the strategy more robust and adaptable to more products, thereby resulting in higher stability.
[/trans]
Strategy Arguments
| Argument | Default | Description |
|---|---|---|
| v_input_1_close | 0 | RSI Source: close |
| v_input_int_1 | 14 | lengthRSI |
| v_input_float_1 | 0.09 | Stop Loss Percentage |
| v_input_float_2 | 0.15 | Take Profit Percentage |
| v_input_2 | 12 | fastlen |
| v_input_3 | 26 | slowlen |
| v_input_4 | 9 | siglen |
| v_input_5 | false | Long Entry Level |
| v_input_6 | false | Exit Level |
| v_input_7 | 8 | Short EMA Length |
| v_input_8 | 21 | Long EMA Length |
| v_input_float_3 | 2 | atrMultiplier |
| v_input_int_2 | 20 | atrLength |
Source (PineScript)
/*backtest
start: 2022-12-29 00:00:00
end: 2024-01-04 00:00:00
period: 1d
basePeriod: 1h
exchanges: [{"eid":"Futures_Binance","currency":"BTC_USDT"}]
*/

//@version=5
strategy("Improved RSI MACD Strategy with Moving Averages", overlay=true)

// Inputs
src = input(close, title="RSI Source")

// RSI Settings
lengthRSI = input.int(14, minval=1)

// Stop Loss Settings
stopLossPct = input.float(0.09, title="Stop Loss Percentage")
takeProfitPct = input.float(0.15, title="Take Profit Percentage")

// MACD Settings
fastlen = input(12)
slowlen = input(26)
siglen = input(9)

// Strategy Settings
longEntry = input(0, title="Long Entry Level")
exitLevel = input(0, title="Exit Level")

// EMA Settings
emaShortLength = input(8, title="Short EMA Length")
emaLongLength = input(21, title="Long EMA Length")

atrMultiplier = input.float(2, title="atrMultiplier")
atrLength = input.int(20, title="atrLength")

// Indicators
rsi1 = ta.rsi(src, lengthRSI)
[macd, signal, hist] = ta.macd(src, fastlen, slowlen, siglen)

// Calculate EMAs
emaShort = ta.ema(src, emaShortLength)
emaLong = ta.ema(src, emaLongLength)

// Calculate ATR
atr = ta.atr(atrLength)

// Variables
var bool canEnterLong = na

// Strategy conditions
longCondition = hist > longEntry and rsi1 > 50 and emaShort > emaLong and close > emaLong + atrMultiplier * atr

// Entries and Exits
if hist < exitLevel and emaShort < emaLong
    canEnterLong := true
    strategy.close("Long")

// Store last entry price
var lastEntryPrice = float(na)
var lastEntryPrice2 = float(na)
if longCondition
    strategy.entry("Long", strategy.long)
    canEnterLong := false
    lastEntryPrice := close
if lastEntryPrice < close
    lastEntryPrice := close
// Calculate Stop Loss and Take Profit Levels based on last entry price
stopLossLevel = lastEntryPrice * (1 - stopLossPct)

// Check for stop loss and take profit levels and close position if triggered
if (strategy.position_size > 0)
    last_buy = strategy.opentrades[0]
    if (close < stopLossLevel)
        strategy.close("Long", comment="Stop Loss Triggered")
    if (close * (1 - takeProfitPct) > strategy.opentrades.entry_price(strategy.opentrades - 1) )
        strategy.close("Long", comment="Take Profit Triggered")
Detail
https://www.fmz.com/strategy/437795
Last Modified
2024-01-05 16:11:23
