Name
双EMA金叉死叉趋势策略Dual-EMA-Crossover-Trend-Strategy
Author
ChaoZhang
Strategy Description
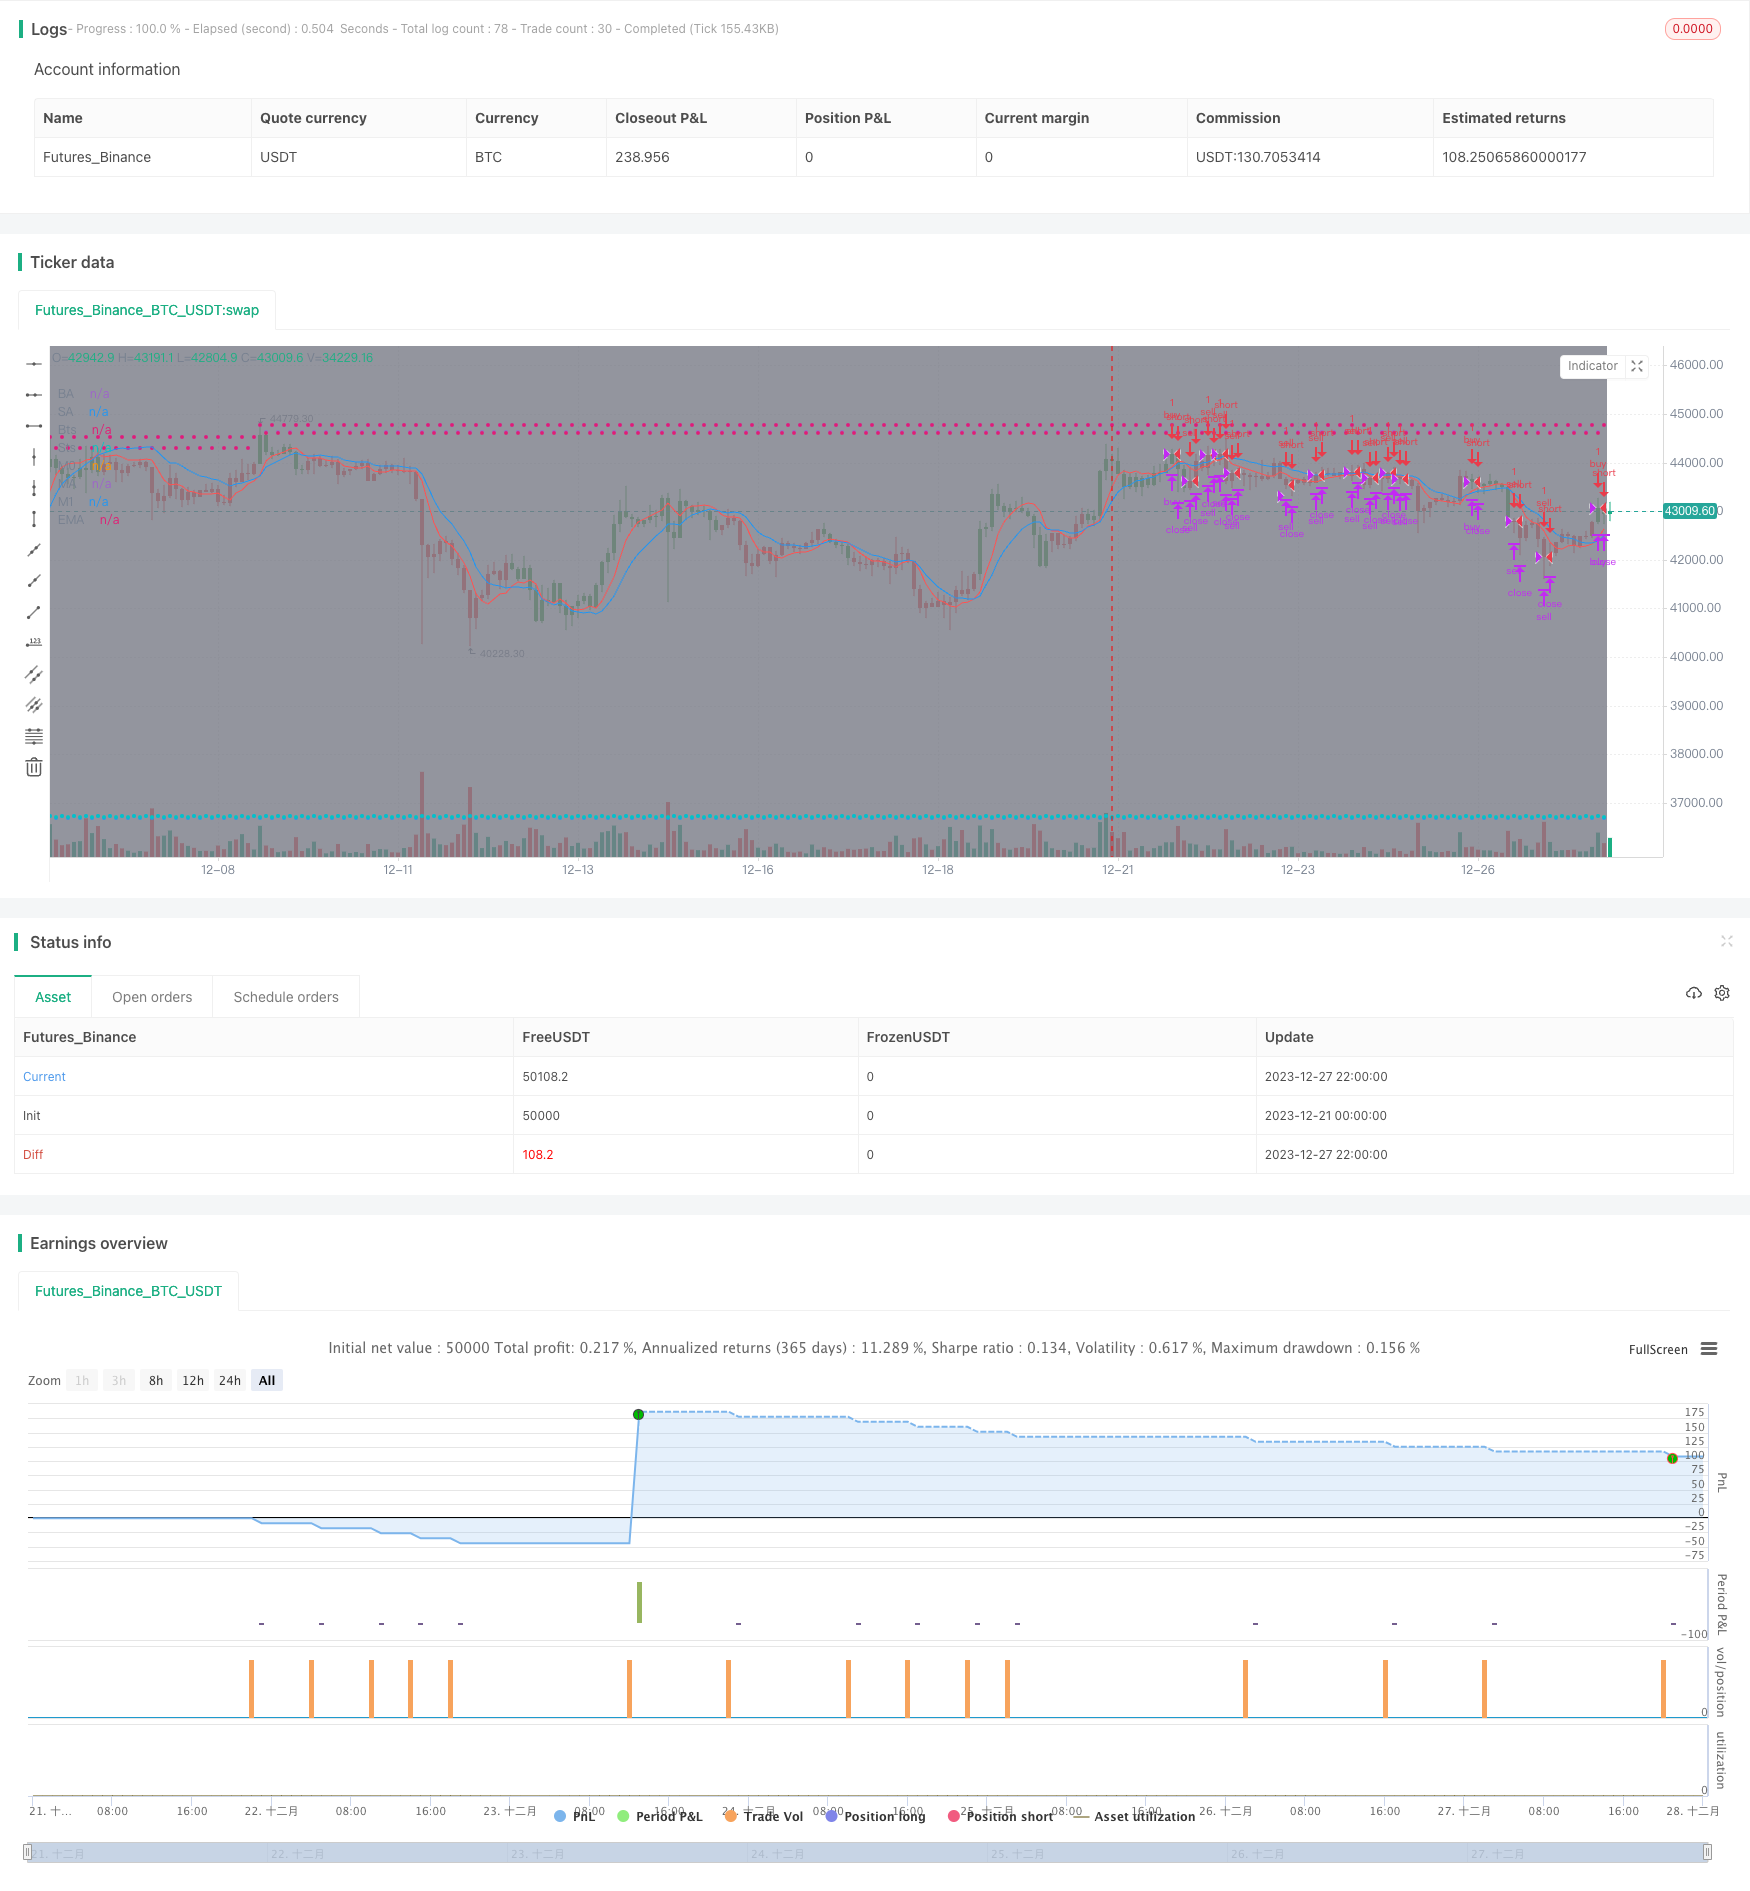
该策略运用双EMA指标的金叉死叉,判断当前趋势方向,并结合RSI指标避免错失买卖机会,属于典型的趋势跟踪策略。
- 计算10期和20期的EMA均线,分别命名为ma00和ma01
- 当ma00上穿ma01时产生买入信号
- 当ma00下穿ma01时产生卖出信号
- 同时,当价格上穿ma00时,如果ma00高于ma01也会产生买入信号
- 类似当价格下穿ma00时,如果ma00低于ma01也会产生卖出信号
- 通过这种双重判断,可以避免错过部分买卖点
- 设置止损和止盈价格,实现风险控制
- 使用双EMA判断,可以有效过滤假突破
- 双重条件判断避免漏单
- 止损止盈设置有利于风险控制
- 双EMA均线策略属于趋势跟踪策略,在震荡行情下买卖频繁,容易止损
- 不能准确判断趋势反转点,可能导致亏损
- 停损点设置不当可能扩大亏损
- 可以适当优化EMA周期,寻找最佳参数组合
- 可以加入其他指标判断,提高策略稳定性
- 可以设置动态止损,根据市场波动实时调整止损点
||
This strategy uses the golden cross and death cross of dual EMA indicators to determine the current trend direction, and combines the RSI indicator to avoid missing buy and sell opportunities. It is a typical trend tracking strategy.
- Calculate the 10-period and 20-period EMA lines, named ma00 and ma01 respectively
- A buy signal is generated when ma00 crosses above ma01
- A sell signal is generated when ma00 crosses below ma01
- At the same time, when price crosses above ma00, if ma00 is above ma01, a buy signal will also be generated
- Similarly, when price crosses below ma00, if ma00 is below ma01, a sell signal will also be generated
- Through such dual validation, some buy and sell points can be avoided missing
- Set stop loss and take profit prices to control risks
- Using dual EMA to determine can effectively filter false breakouts
- Dual condition validation avoids missing orders
- Stop loss and take profit settings are beneficial for risk management
- The dual EMA strategy belongs to the trend tracking strategy. Frequent buys and sells in sideways markets can easily hit stop loss
- It cannot accurately determine trend reversal points, which may lead to losses
- Improper stop loss point settings may amplify losses
- EMA cycles can be properly optimized to find the best parameter combination
- Other indicators can be added to improve strategy stability
- Dynamic stops can be set to adjust stop loss points in real time based on market fluctuations
[/trans]
Strategy Arguments
| Argument | Default | Description |
|---|---|---|
| v_input_1 | true | Use Trading Session? |
| v_input_2 | true | Use Trailing Stop? |
| v_input_3 | 0400-1500 | Trade Session: |
| v_input_4 | true | Trade Size: |
| v_input_5 | 55 | Take profit in pips: |
| v_input_6 | 11 | Stop loss in pips: |
| v_input_7 | 10 | EMA length: |
| v_input_8 | 20 | DEMA length: |
| v_input_9_open | 0 | Price source:: open |
Source (PineScript)
/*backtest
start: 2023-12-21 00:00:00
end: 2023-12-28 00:00:00
period: 2h
basePeriod: 15m
exchanges: [{"eid":"Futures_Binance","currency":"BTC_USDT"}]
*/

//@version=4

strategy(title='[STRATEGY][RS]MicuRobert EMA cross V1', shorttitle='S', overlay=true, pyramiding=0, initial_capital=100000)
USE_TRADESESSION = input(title='Use Trading Session?', type=bool, defval=true)
USE_TRAILINGSTOP = input(title='Use Trailing Stop?', type=bool, defval=true)
trade_session = input(title='Trade Session:',  defval='0400-1500', confirm=false)
istradingsession = not USE_TRADESESSION ? false : not na(time('1', trade_session))
bgcolor(istradingsession?color.gray:na)
trade_size = input(title='Trade Size:', type=float, defval=1)
tp = input(title='Take profit in pips:', type=float, defval=55.0) * (syminfo.mintick*10)
sl = input(title='Stop loss in pips:', type=float, defval=11.0) * (syminfo.mintick*10)
ma_length00 = input(title='EMA length:',  defval=10)
ma_length01 = input(title='DEMA length:',  defval=20)
price = input(title='Price source:', defval=open)

//  ||--- NO LAG EMA, Credit LazyBear:  ---||
f_LB_zlema(_src, _length)=>
    _ema1=ema(_src, _length)
    _ema2=ema(_ema1, _length)
    _d=_ema1-_ema2
    _zlema=_ema1+_d
//  ||-------------------------------------||

ma00 = f_LB_zlema(price, ma_length00)
ma01 = f_LB_zlema(price, ma_length01)
plot(title='M0', series=ma00, color=black)
plot(title='M1', series=ma01, color=black)

isnewbuy = change(strategy.position_size)>0 and change(strategy.opentrades)>0
isnewsel = change(strategy.position_size)<0 and change(strategy.opentrades)>0

buy_entry_price = isnewbuy ? price : buy_entry_price[1]
sel_entry_price = isnewsel ? price : sel_entry_price[1]
plot(title='BE', series=buy_entry_price, style=circles, color=strategy.position_size <= 0 ? na : aqua)
plot(title='SE', series=sel_entry_price, style=circles, color=strategy.position_size >= 0 ? na : aqua)
buy_appex = na(buy_appex[1]) ? price : isnewbuy ? high : high >= buy_appex[1] ? high : buy_appex[1]
sel_appex = na(sel_appex[1]) ? price : isnewsel ? low : low <= sel_appex[1] ? low : sel_appex[1]
plot(title='BA', series=buy_appex, style=circles, color=strategy.position_size <= 0 ? na : teal)
plot(title='SA', series=sel_appex, style=circles, color=strategy.position_size >= 0 ? na : teal)
buy_ts = buy_appex - sl
sel_ts = sel_appex + sl
plot(title='Bts', series=buy_ts, style=circles, color=strategy.position_size <= 0 ? na : red)
plot(title='Sts', series=sel_ts, style=circles, color=strategy.position_size >= 0 ? na : red)

buy_cond1 = crossover(ma00, ma01) and (USE_TRADESESSION ? istradingsession : true)
buy_cond0 = crossover(price, ma00) and ma00 > ma01 and (USE_TRADESESSION ? istradingsession : true)
buy_entry = buy_cond1 or buy_cond0
buy_close = (not USE_TRAILINGSTOP ? false : low <= buy_ts) or high>=buy_entry_price+tp//high>=last_traded_price + tp or low<=last_traded_price - sl //high >= hh or
sel_cond1 = crossunder(ma00, ma01) and (USE_TRADESESSION ? istradingsession : true)
sel_cond0 = crossunder(price, ma00) and ma00 < ma01 and (USE_TRADESESSION ? istradingsession : true)
sel_entry = sel_cond1 or sel_cond0
sel_close = (not USE_TRAILINGSTOP ? false : high >= sel_ts) or low<=sel_entry_price-tp//low<=last_traded_price - tp or high>=last_traded_price + sl //low <= ll or

strategy.entry('buy', long=strategy.long, qty=trade_size, comment='buy', when=buy_entry)
strategy.close('buy', when=buy_close)
strategy.entry('sell', long=strategy.short, qty=trade_size, comment='sell', when=sel_entry)
strategy.close('sell', when=sel_close)

//What i add .!
pos = iff(ma01 < ma00 , 1,
	    iff(ma01 > ma00 , -1, nz(pos[1], 0)))
barcolor(pos == -1 ? red: pos == 1 ? green : blue)
plot(ma00, color=red, title="MA")
plot(ma01, color=blue, title="EMA")
Detail
https://www.fmz.com/strategy/437017
Last Modified
2023-12-29 15:46:15
