Name
双重和谐系统策略Harmonic-Dual-System-Strategy
Author
ChaoZhang
Strategy Description
概述
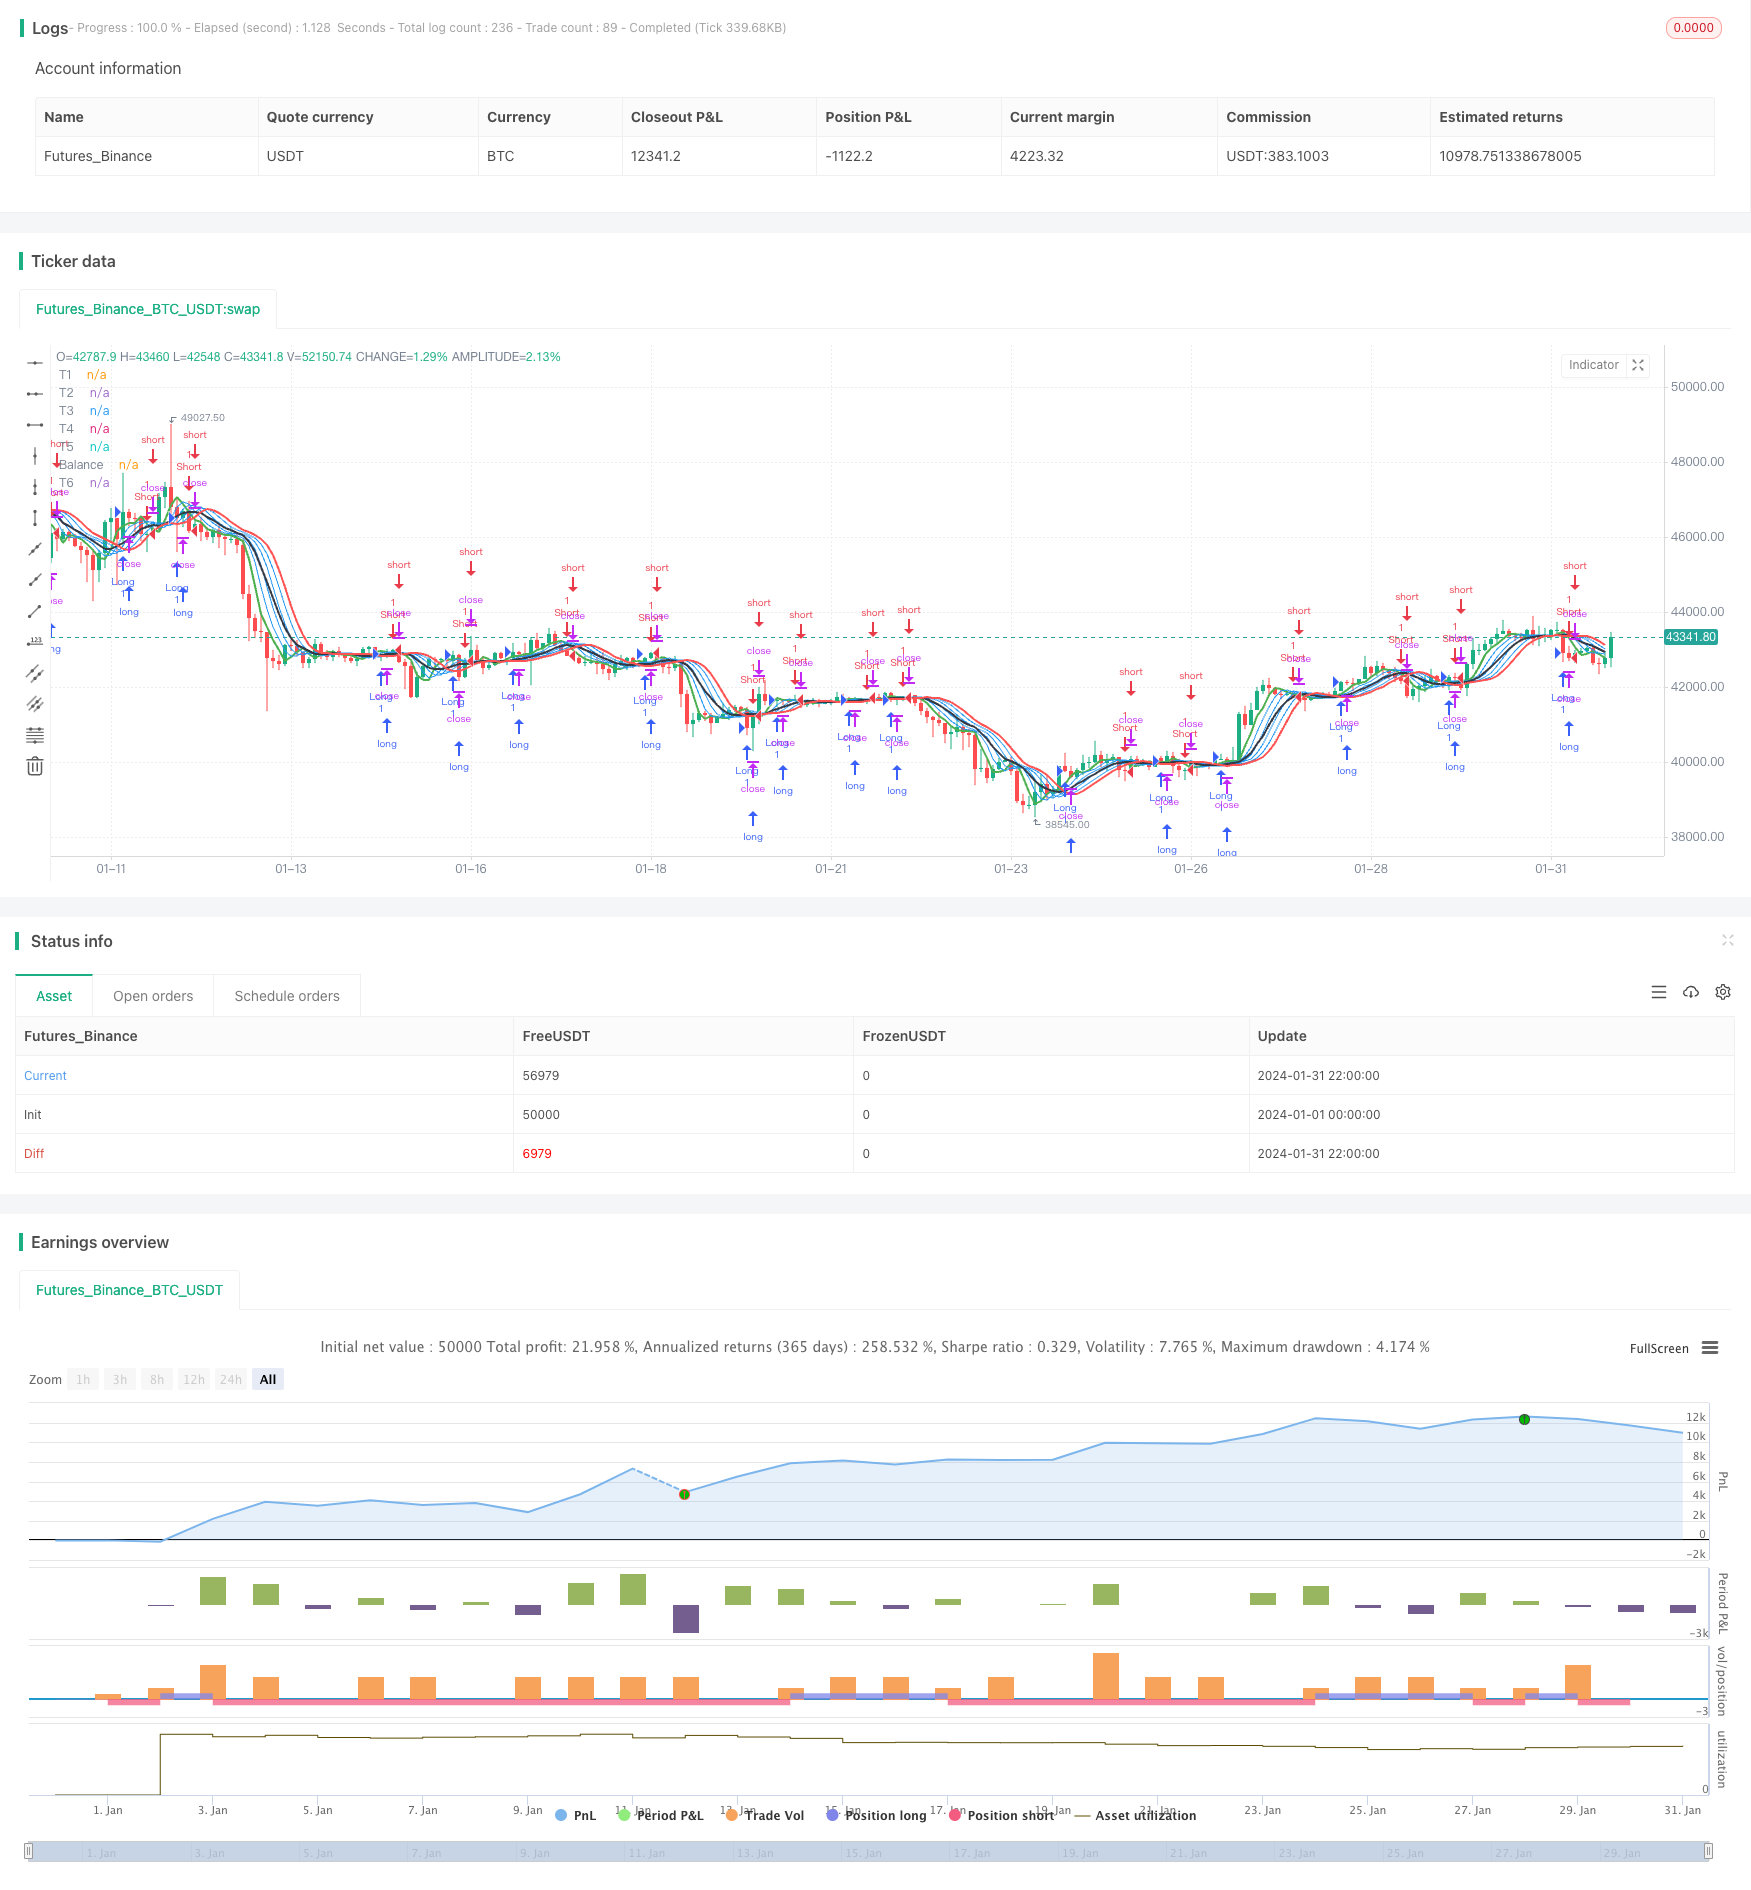
该策略运用了多次和谐平均来构建交易信号。策略首先计算1到6阶的和谐平均,然后结合这些和谐平均构建长短双重交易信号。当短期信号线下穿长期信号线时做空,当短期信号线上穿长期信号线时做多。
策略原理
该策略首先定义了一个harm_average函数,用于计算n日和谐平均。然后分别计算1到6阶的和谐平均,即T1到T6。其中T1为3日和谐平均,T2为T1的3日和谐平均,以此类推。
之后构建Balance曲线,Balance曲线综合考虑T1到T6的立方和谐平均的倒数。这样可以同时反映短期和长期因素。
最后,根据T1到T6构建长短交叉交易信号,即X1为T1、T2、T3中的最小值,X2为T4、T5、T6中的最大值。当X1上穿X2时做多,X1下穿X2时做空。这里X1反映短期因素,X2反映长期因素。
优势分析
-
使用多重和谐平均能够有效过滤市场噪音,提高交易信号质量
-
构建长短交叉交易信号,可以及时捕捉趋势的转折点
-
Balance曲线综合考虑多重时间周期,能够准确判断趋势方向
-
采用立方平均能够进一步突出中间变量的作用,提高策略稳定性
风险分析
-
和谐平均本身滞后性较强,可能错过短期逆转机会
-
多重平均可能会过度优化,降低策略鲁棒性
-
立方运算可能放大中间噪声,带来一定假信号
-
长短交叉存在一定程度的滞后,无法及时捕捉转折
优化方向
-
可以测试更多种类或者更多重的和谐平均组合
-
可以引入动态参数调整平均天数,优化平均系统
-
可以测试不同的幂参数,如平方、对数等组合
-
可以结合更多辅助指标验证交易信号质量
总结
本策略运用多重和谐平均系统构建长短交叉交易信号。相比单一平均系统,本策略可以更好地识别趋势,过滤噪声。同时长短交叉也能及时捕捉市场转折。但是策略中多重平均和立方运算也带来了一定程度的滞后和噪声放大。未来可通过引入动态调整参数和更多辅助指标来提升策略的稳定性和及时性。
||
Overview
This strategy uses multiple harmonic moving averages to construct trading signals. It first calculates the harmonic moving averages from 1st to 6th order, and then combines these moving averages to build dual long/short trading signals. It goes short when the short-term signal line crosses below the long-term one, and goes long when the short-term signal line crosses above.
Strategy Logic
The strategy first defines a harm_average function to calculate the n-period harmonic moving average. Then it calculates the harmonic moving averages from 1st to 6th order, namely T1 to T6. Among them, T1 is the 3-period harmonic moving average, T2 is the 3-period harmonic moving average of T1, and so on.
After that, it constructs a Balance curve, which synthetically considers the inverse of the cubic harmonic moving averages from T1 to T6. This can reflect both short-term and long-term factors at the same time.
Finally, according to T1 to T6, it builds dual long/short cross-trading signals, where X1 takes the minimum of T1, T2 and T3, and X2 takes the maximum of T4, T5 and T6. It goes long when X1 crosses above X2, and goes short when X1 crosses below X2. Here X1 reflects short-term factors and X2 reflects long-term factors.
Advantage Analysis
-
Using multiple harmonic moving averages can effectively filter market noise and improve signal quality
-
Building dual long/short trading signals can timely capture trend turning points
-
The Balance curve synthetically considers multiple timeframes, which can accurately judge trend direction
-
Adopting cube averaging can further highlight the role of intermediate variables and enhance strategy stability
Risk Analysis
-
Harmonic averages themselves have high laggingness, which may miss short-term reversal opportunities
-
Excessive optimization with multiple averages may reduce strategy robustness
-
Cube computations may amplify intermediate noise to some extent, resulting in certain false signals
-
Dual crosses have some degree of laggingness, unable to timely capture turning points
Optimization Directions
-
More types or higher orders of harmonic averages can be tested
-
Introduce dynamic adjustment of average days to optimize the averaging system
-
Test different power parameters like squares and logs
-
Incorporate more auxiliary indicators to verify signal quality
Summary
This strategy uses a multiple harmonic averaging system to construct dual long/short trading signals. Compared with single averaging systems, this strategy can better identify trends and filter out noise. Meanwhile, the dual crosses can also timely capture market turning points. However, the multiple averaging and cube computations also introduce some laggingness and noise amplification. In the future, introducing dynamic parameter tuning and more auxiliary indicators may improve strategy stability and timeliness.
[/trans]
Source (PineScript)
/*backtest
start: 2024-01-01 00:00:00
end: 2024-01-31 23:59:59
period: 2h
basePeriod: 15m
exchanges: [{"eid":"Futures_Binance","currency":"BTC_USDT"}]
*/

//@version=4
strategy("Harmonic System Strategy", overlay=true)

harm_average(x,y,z) =>3 / (1 / x + 1 / y + 1 / z)
T1 = harm_average(close[1], close[2], close[3])
T2 = harm_average(T1, T1[1], T1[2])
T3 = harm_average(T2, T2[1], T2[2])
T4 = harm_average(T3, T3[1], T3[2])
T5 = harm_average(T4, T4[1], T4[2])
T6 = harm_average(T5, T5[1], T5[2])
Balance = 18 / (1 / T1 * 3 + 1 / T2 * 3 + 1 / T3 * 3 + 1 / T4 * 3 + 1 / T5 * 3 + 1 / T6 * 3)

plot(T1,linewidth=2, color=color.green,title="T1")
plot(T2,linewidth=1, color=color.blue,title="T2")
plot(T3,linewidth=1, color=color.blue,title="T3")
plot(Balance,linewidth=2, color=color.black,title="Balance")
plot(T4,linewidth=1, color=color.blue,title="T4")
plot(T5,linewidth=1, color=color.blue,title="T5")
plot(T6,linewidth=2, color=color.red,title="T6")

X1 = min(min(T1,T2),T3)
X2 = max(max(T4,T5),T6)
X3 = min(T1,T2)
X4 = max(T3,T4)

Buy=crossover(X1,X2)
Sell=crossunder(X3,X4)

if crossover(X1,X2)
    strategy.entry("Long", strategy.long, comment="Long")

if crossunder(X3,X4)
    strategy.entry("Short", strategy.short, comment="Short")
Detail
https://www.fmz.com/strategy/442520
Last Modified
2024-02-22 15:49:06
