Name
双边三点移位均线量化交易策略Bilateral-Three-Point-Moving-Average-Quantitative-Trading-Strategy
Author
ChaoZhang
Strategy Description
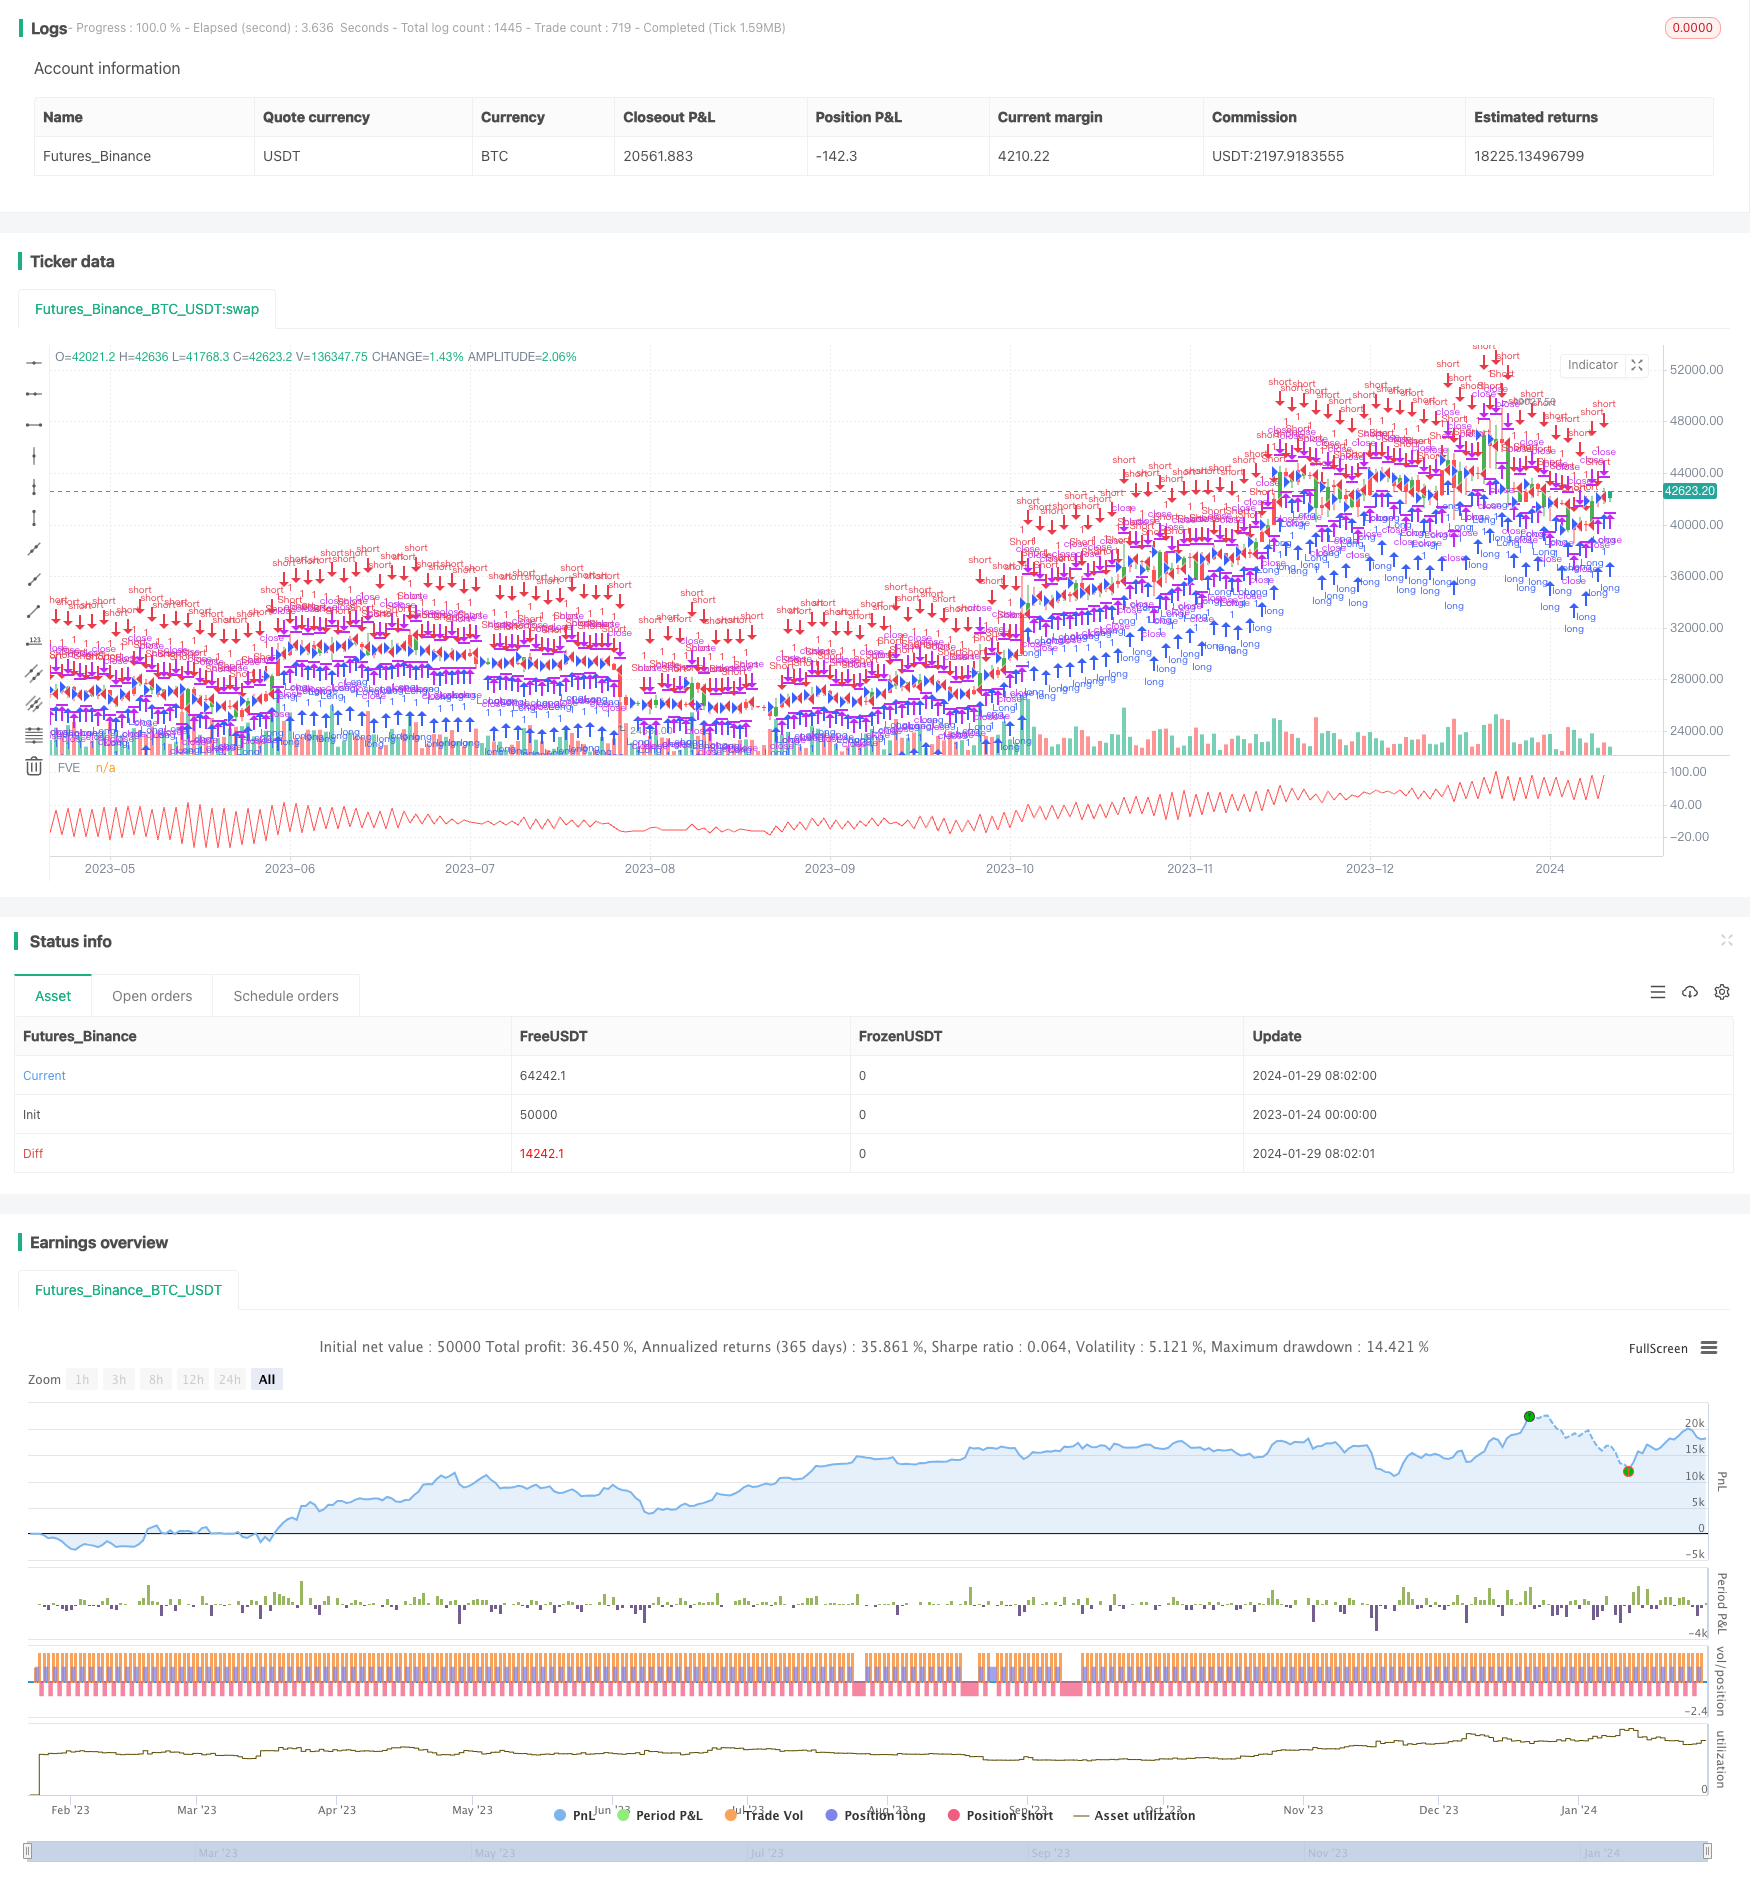
本策略基于双边三点移位均线指标,通过计算最近N周期的最高价、最低价和收盘价的均值,实现判断价格趋势和发出交易信号的功能。该策略适用于中短线交易,可以有效过滤市场噪音,顺势捕捉价格趋势。
本策略的核心指标是双边三点移位均线(XHL2、XHLC3)。其中,XHL2计算最近N周期的最高价和最低价的均值。XHLC3计算最近N周期的最高价、最低价和收盘价的均值。这两个指标可以有效平滑价格数据,过滤掉短期波动的影响。
策略通过计算XHL2、XHLC3和收盘价的差值nMF判断价格走势。当nMF大于一个因子时,判断为价格上涨趋势;当nMF小于负的因子时,判断为价格下跌趋势。结合交易量,计算出指标nRES,其大于0表示买入信号,小于0表示卖出信号。根据nRES的正负和大小关系判断趋势方向和产生交易信号。
本策略的优势有:
-
使用双边三点移位均线指标,可以有效过滤市场噪音,判断价格中长期趋势;
-
结合交易量变化,可以更准确判断资金流向,发出交易信号;
-
策略参数较少,方法简单易懂,容易实施;
-
可灵活设定持仓方向,适用于不同类型的投资者。
本策略的主要风险有:
-
参数设置不当可能导致交易信号错误;
-
长期强势行情时,策略可能产生过多错误交易信号;
-
行情剧烈波动时,止损设置过小可能增加亏损风险。
对应解决方法:
-
优化参数,结合回测确定最佳参数;
-
结合趋势和支持阻力判断信号的可靠性;
-
适当放宽止损幅度,控制单笔损失。
本策略的优化方向:
-
优化均线参数和交易量参数,提高指标的敏感性;
-
增加趋势判断指标,提高交易信号准确性;
-
增加止损策略,降低亏损风险;
-
结合机器学习方法,实现参数的自动优化。
本策略基于双边三点移位均线指标设计,判断价格中长期趋势方向,利用交易量变化确认资金流入流出,最终产生买入卖出交易信号。策略优化空间较大,可从多个维度进行改进,使其适应更加复杂的市场环境。
||
This strategy is based on the bilateral three-point moving average indicator. By calculating the mean value of the highest price, lowest price and closing price of the most recent N periods, it realizes the function of judging price trends and generating trading signals. This strategy is suitable for medium and short term trading, and can effectively filter market noise and capture price trends.
The core indicator of this strategy is the bilateral three-point moving average (XHL2, XHLC3). XHL2 calculates the mean value of the highest price and lowest price of the most recent N periods. XHLC3 calculates the mean value of the highest price, lowest price and closing price of the most recent N periods. These two indicators can effectively smooth price data and filter out the impact of short-term fluctuations.
The strategy judges the price trend by calculating the difference nMF between XHL2, XHLC3 and the closing price. When nMF is greater than a factor, it is judged that the price is in an upward trend; when nMF is less than a negative factor, it is judged that the price is in a downward trend. Combined with trading volume, the indicator nRES is calculated. nRES greater than 0 indicates a buy signal, and less than 0 indicates a sell signal. Trend direction and trading signals are determined based on the positive/negative sign and magnitude relationship of nRES.
The advantages of this strategy are:
-
Using the bilateral three-point moving average indicator can effectively filter market noise and judge medium and long term price trends;
-
Combining changes in trading volume can more accurately determine the direction of capital flow and issue trading signals;
-
The strategy has few parameters, simple and easy to understand methods, and is easy to implement;
-
Flexible setting of holding direction, suitable for different types of investors.
The main risks of this strategy are:
-
Improper parameter settings may cause erroneous trading signals;
-
In a long-term strong trending market, the strategy may generate too many false trading signals;
-
In a volatile market, excessively small stop loss settings may increase the risk of loss.
Solutions:
-
Optimize parameters and determine the best parameters based on backtesting;
-
Judge the reliability of signals in combination with trends and support/resistance;
-
Appropriately relax the stop loss range to control single loss.
The optimization directions of this strategy:
-
Optimize the moving average parameters and trading volume parameters to improve the sensitivity of the indicator;
-
Add trend judgment indicators to improve the accuracy of trading signals;
-
Add stop loss strategies to reduce risk of loss;
-
Combine machine learning methods to achieve automatic parameter optimization.
This strategy is designed based on the bilateral three-point moving average indicator to determine the medium and long term trend direction of prices. It uses changes in trading volume to confirm capital inflows and outflows, and finally generates buy and sell trading signals. The strategy has large room for optimization and can be improved in multiple dimensions to adapt to more complex market environments. [/trans]
Strategy Arguments
| Argument | Default | Description |
|---|---|---|
| v_input_1 | 22 | Period |
| v_input_2 | 0.3 | Factor |
| v_input_3 | false | Trade reverse |
Source (PineScript)
/*backtest
start: 2023-01-24 00:00:00
end: 2024-01-30 00:00:00
period: 1d
basePeriod: 1h
exchanges: [{"eid":"Futures_Binance","currency":"BTC_USDT"}]
*/

//@version=2
////////////////////////////////////////////////////////////
//  Copyright by HPotter v1.0 25/06/2018
// The FVE is a pure volume indicator. Unlike most of the other indicators
// (except OBV), price change doesn?t come into the equation for the FVE (price
// is not multiplied by volume), but is only used to determine whether money is
// flowing in or out of the stock. This is contrary to the current trend in the
// design of modern money flow indicators. The author decided against a price-volume
// indicator for the following reasons:
// - A pure volume indicator has more power to contradict.
// - The number of buyers or sellers (which is assessed by volume) will be the same,
//     regardless of the price fluctuation.
// - Price-volume indicators tend to spike excessively at breakouts or breakdowns.
//
// You can change long to short in the Input Settings
// WARNING:
// - For purpose educate only
// - This script to change bars colors.
////////////////////////////////////////////////////////////
strategy(title="Finite Volume Elements (FVE) Backtest", shorttitle="FVE")
Period = input(22, minval=1)
Factor = input(0.3, maxval=1)
reverse = input(false, title="Trade reverse")
xhl2 = hl2
xhlc3 = hlc3
xClose = close
xVolume = volume
xSMAV = sma(xVolume, Period)
nMF = xClose - xhl2 + xhlc3 - xhlc3[1]
nVlm = iff(nMF > Factor * xClose / 100,  xVolume,
         iff(nMF < -Factor * xClose / 100, -xVolume, 0))
nRes = nz(nRes[1],0) + ((nVlm / xSMAV) / Period) * 100
pos = iff(nRes > nRes[1] and nRes > nRes[2], 1,
         iff(nRes < nRes[1] and nRes < nRes[2], -1, nz(pos[1], 0)))
possig = iff(reverse and pos == 1, -1,
          iff(reverse and pos == -1, 1, pos))
if (possig == 1)
    strategy.entry("Long", strategy.long)
if (possig == -1)
    strategy.entry("Short", strategy.short)
barcolor(possig == -1 ? red: possig == 1 ? green : blue )
plot(nRes, color=red, title="FVE")
Detail
https://www.fmz.com/strategy/440552
Last Modified
2024-01-31 16:11:41
