Name
双移动均线与布林带结合的趋势追踪策略Dual-Moving-Average-and-Bollinger-Band-Combination-Trend-Tracking-Strategy
Author
ChaoZhang
Strategy Description
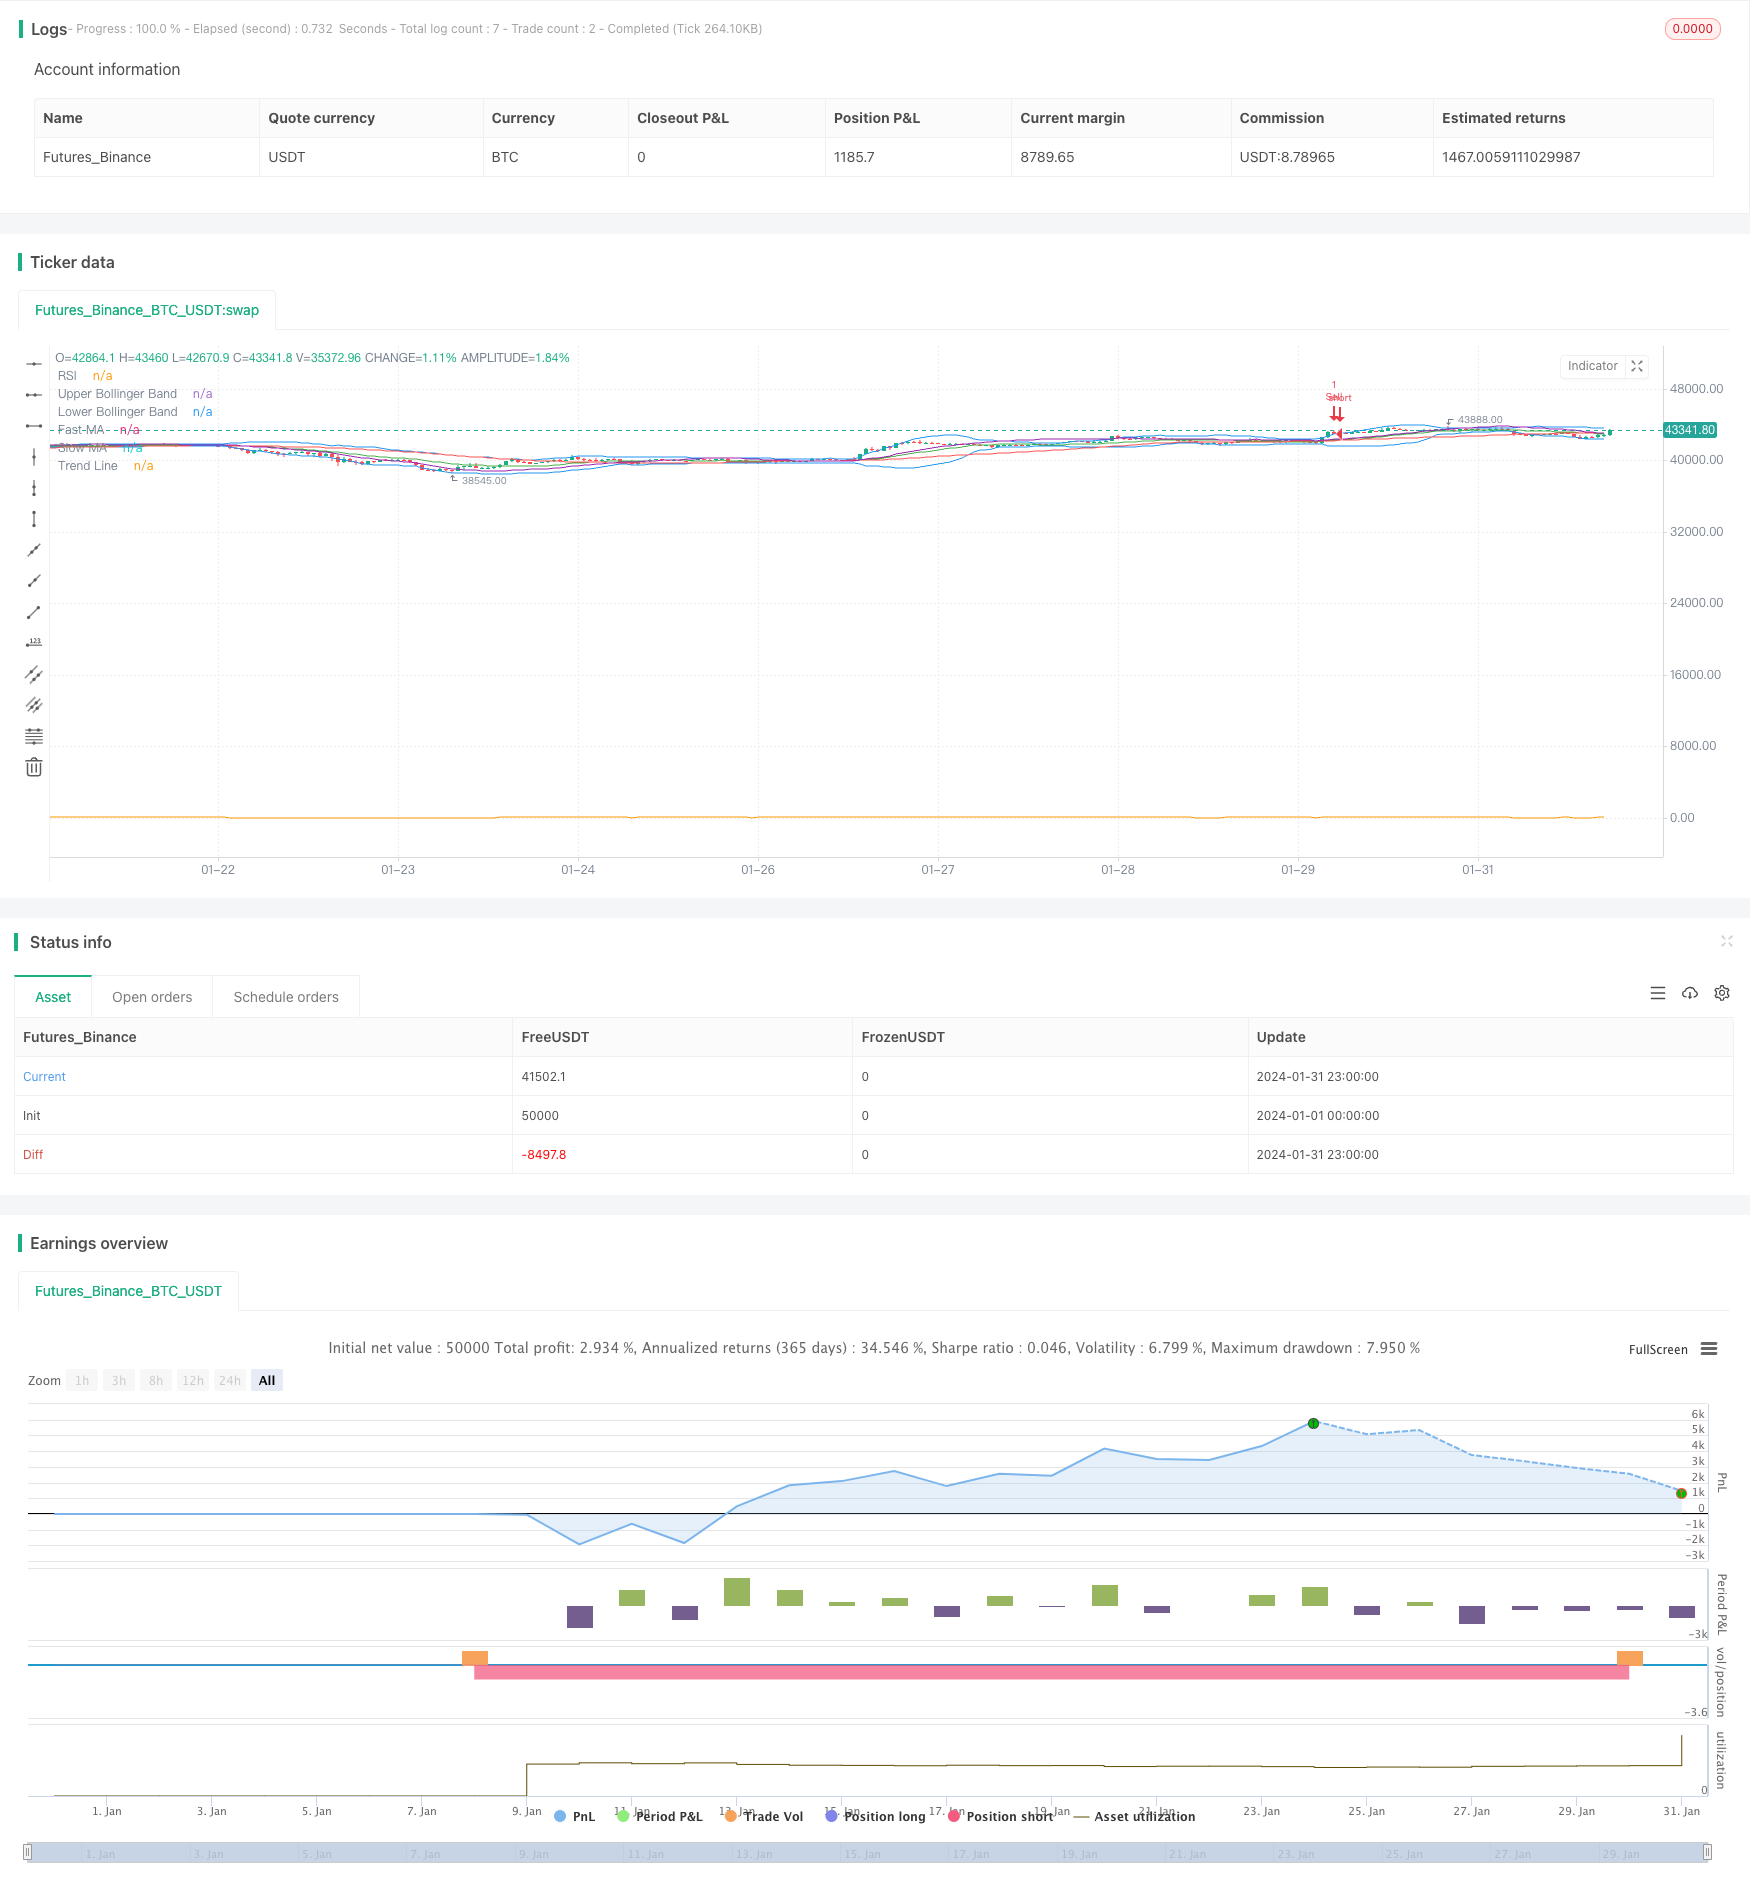
该策略结合了双移动均线、相对强弱指标(RSI)和布林带等多个技术指标,根据它们构建买入和卖出信号,目的是识别潜在的趋势反转点和超买超卖情况,追踪股价趋势进行交易。
该策略的主要买入信号来自RSI和布林带。当RSI低于超卖线30时视为超卖,这时如果价格接近或触及布林带下轨,就产生买入信号。这表示股价可能反转上涨。
该策略的主要卖出信号也来自RSI和布林带。当RSI超过超买线70时视为超买,这时如果价格接近或超过布林带上轨,就产生卖出信号。这表示股价可能反转下跌。
此外,策略中还计算了20日和50日的简单移动平均线。它们可用来判断趋势方向。快速移动平均线位于慢速移动平均之上时,表示处于上升趋势;反之,则表示下降趋势。
该策略结合多种指标识别买卖点,可以有效捕捉价格趋势反转,追踪价格变化。其主要优势有:
-
使用布林带识别超买超卖区域。布林带通过标准差定义价格波动范围,能很好地识别价格异常情况。
-
RSI指标可有效识别超买超卖状态。RSI高于70视为超买区,低于30视为超卖区,可在价格反转前给出信号。
-
双移动均线判断整体趋势方向,避免在没有趋势的市场中交易。
-
通过组合多种指标,可以过滤假信号,识别高概率的买卖点。
该策略主要风险在于:
-
布林带参数设置不当,上下轨无法有效界定价格波动范围。这可能导致产生大量假信号。
-
RSI参数不同,其超买超卖判断标准会改变,信号产生的效果也会变化。
-
双移动均线参数不同,其判断的整体趋势也会有偏差。
-
策略信号可能滞后,无法在价格反转的最初给出指示。这可能导致一定的滑点损失。
-
行情剧烈波动时,多种指标可能出现失效情况,无法有效识别买卖点。
针对以上风险,可以通过调整参数、组合更多指标等方法进行优化,使策略更加稳健。
该策略可以从以下几个方面进行优化:
-
使用自适应布林带,根据市场波动程度动态调整参数,使上下轨更准确。
-
增加VOLUME等指标过滤,只在成交量放大的情况下产生信号,可避免虚假突破。
-
设置价格止损线,当价格向不利方向运行时及时止损。
-
对交易品种、交易时段等进行测试优化,使策略参数针对不同情况有所调整。
-
增加机器学习算法,利用历史数据训练,自动优化参数设置。
该策略整合布林带、RSI、双移动均线等多个指标,建立完整的买卖规则,能有效识别价格趋势、判断超买超卖区域,在股价反转前给出交易信号。通过参数优化、增加过滤条件、设置止损等手段,可以进一步提高策略的稳定性。总体来说,该策略结合趋势和超买超卖指标,能捕捉反转机会,值得进一步优化实盘验证。
||
This strategy combines dual moving averages, relative strength index (RSI) and Bollinger bands and other technical indicators to build buy and sell signals for the purpose of identifying potential trend reversal points and overbought/oversold conditions to track price trends for trading.
The main buy signals of this strategy come from RSI and Bollinger bands. When RSI is below the oversold line of 30, it is viewed as oversold. At this time, if the price approaches or touches the lower rail of the Bollinger bands, a buy signal is generated. This indicates the price may reverse upward.
The main sell signals also come from RSI and Bollinger bands. When RSI exceeds the overbought line of 70, it is viewed as overbought. At this time, if the price approaches or exceeds the upper rail of the Bollinger bands, a sell signal is generated. This indicates the price may reverse downward.
In addition, the strategy calculates the 20-day and 50-day simple moving averages. They can be used to judge the trend direction. When the fast moving average is above the slow moving average, it indicates an upward trend; otherwise, it indicates a downward trend.
This strategy combines multiple indicators to identify buy and sell points, which can effectively capture price trend reversals and track price changes. Its main advantages are:
-
Use Bollinger bands to identify overbought/oversold zones. Bollinger bands define price fluctuation ranges well through standard deviation and can identify abnormal price situations.
-
The RSI indicator can effectively identify overbought/oversold status. RSI above 70 is viewed as overbought zone and below 30 as oversold zone, which can signal ahead of price reversal.
-
The dual moving averages determine the overall trend direction to avoid trading in market without a trend.
-
By combining multiple indicators, false signals can be filtered and high probability buy/sell points can be identified.
The main risks of this strategy are:
-
Improper Bollinger band parameter settings may fail to effectively define the price fluctuation range. This may generate a lot of false signals.
-
Different RSI parameters lead to different overbought/oversold criteria and signal generation effects.
-
Different dual moving average parameters lead to bias in judging the overall trend.
-
Strategy signals may lag and fail to give guidance at the very beginning of price reversal. This may lead to certain amount of slippage loss.
-
When the market fluctuates violently, multiple indicators may fail and become ineffective in identifying buy/sell points.
To address the above risks, methods like parameter tuning, combining more indicators can be adopted to optimize the strategy for more robustness.
The strategy can be optimized in the following aspects:
-
Use adaptive Bollinger bands to dynamically adjust parameters based on market volatility to make the upper/lower rails more accurate.
-
Add VOLUME and other indicators for filtration, only generating signals when trading volume amplifies, in order to avoid false breakout.
-
Set price stop loss line and stop loss in time when price runs in unfavorable direction.
-
Conduct tests and optimizations towards trading products, trading sessions etc, so that strategy parameters can be adjusted accordingly.
-
Increase machine learning algorithms, automatically optimizing parameter settings through training over historical data.
This strategy integrates Bollinger bands, RSI, dual moving averages and other indicators to establish complete buy and sell rules, which can effectively identify price trends, judge overbought/oversold zones, and give trading signals ahead of price reversal. Through means like parameter optimization, adding filtering conditions, setting stop loss etc, the strategy's stability can be further improved. In general, by combining trend and overbought/oversold indicators, this strategy can capture reversal opportunities and is worth further optimizations and verifications in live trading.
[/trans]
Strategy Arguments
| Argument | Default | Description |
|---|---|---|
| v_input_1 | 20 | BB Length |
| v_input_2 | 2 | BB MultFactor |
| v_input_3 | 14 | RSI Length |
| v_input_4 | 30 | RSI Oversold |
| v_input_5 | 70 | RSI Overbought |
Source (PineScript)
/*backtest
start: 2024-01-01 00:00:00
end: 2024-01-31 23:59:59
period: 1h
basePeriod: 15m
exchanges: [{"eid":"Futures_Binance","currency":"BTC_USDT"}]
*/

//@version=4
strategy("RSA", overlay=true)

// Bollinger Bands
bb_length = input(20, title="BB Length")
bb_mult = input(2.0, title="BB MultFactor")
bb_basis = sma(close, bb_length)
bb_upper = bb_basis + bb_mult * stdev(close, bb_length)
bb_lower = bb_basis - bb_mult * stdev(close, bb_length)

// RSI
rsi_length = input(14, title="RSI Length")
rsi_oversold = input(30, title="RSI Oversold")
rsi_overbought = input(70, title="RSI Overbought")
rsi_value = rsi(close, rsi_length)

// Buy and Sell Conditions
buy_condition = crossover(rsi_value, rsi_oversold) and (close < bb_lower)
sell_condition = crossunder(rsi_value, rsi_overbought) and (close > bb_upper)

// Add Buy and Sell Signals
if (buy_condition)
    strategy.order("Buy", strategy.long)
if (sell_condition)
    strategy.order("Sell", strategy.short)

// Plot Bollinger Bands
plot(bb_upper, color=color.blue, title="Upper Bollinger Band")
plot(bb_lower, color=color.blue, title="Lower Bollinger Band")

// Plot RSI
plot(rsi_value, color=color.orange, title="RSI")

// Plot Moving Averages
fast_ma = sma(close, 20)
slow_ma = sma(close, 50)
plot(fast_ma, color=color.green, title="Fast MA")
plot(slow_ma, color=color.red, title="Slow MA")

// Plot Trend Lines
trend_line = linreg(close, 50, 0)
plot(trend_line, color=color.purple, title="Trend Line")
Detail
https://www.fmz.com/strategy/442546
Last Modified
2024-02-22 17:01:05
