Name
双层RSI交易策略Double-Decker-RSI-Trading-Strategy
Author
ChaoZhang
Strategy Description
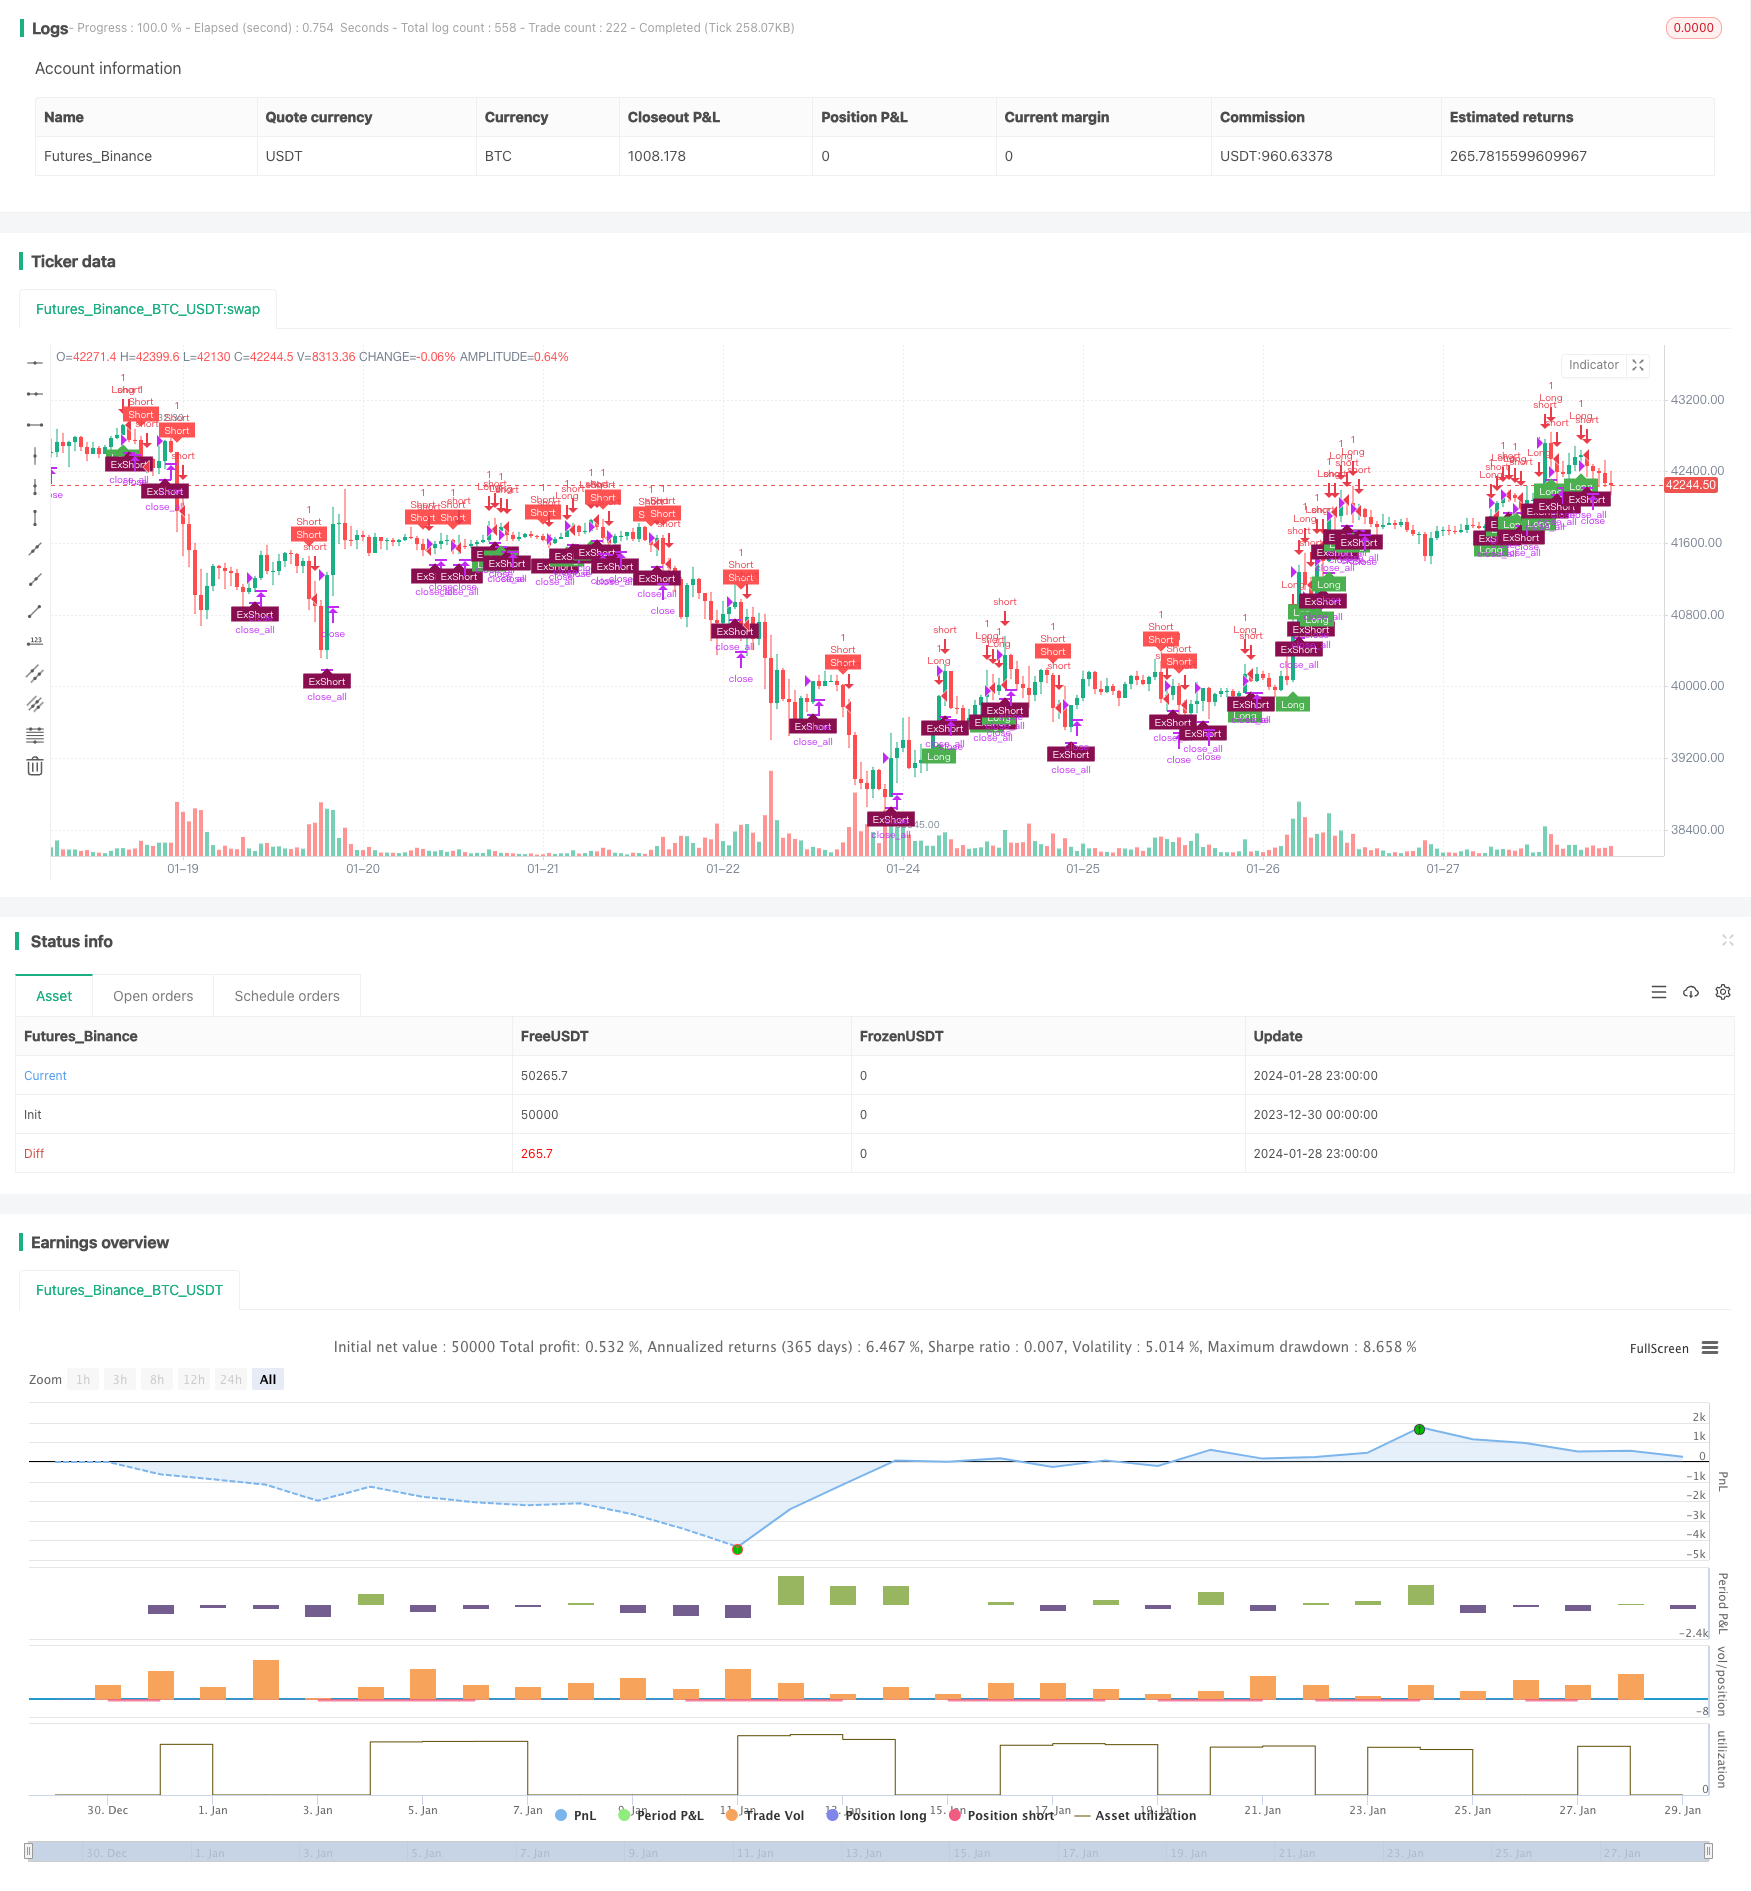
双层RSI交易策略是一种基于相对强弱指数(RSI)的量化交易策略。该策略同时利用快速RSI和慢速RSI作为交易信号,实现双重确认,旨在提高信号质量,过滤假信号。
该策略使用两个不同周期的RSI作为主要交易指标。快速RSI周期为5天,用于捕捉短期超买超卖情况;慢速RSI周期为14天,用于判断中长期趋势和关键支撑阻力。
具体交易规则为:
- 当快速RSI上穿70而慢速RSI高于50时,做多;当快速RSI下穿30而慢速RSI低于50时,做空
- 做多止损线为快速RSI下穿55;做空止损线为快速RSI上穿45
该策略通过快慢RSI的组合使用,实现不同周期之间的互补,能够有效识别超买超卖情况的同时确认中长期趋势,从而产生高质量的交易信号。双重RSI过滤机制也能够减少假突破带来的噪音交易。
双层RSI策略最大的优势在于能够有效过滤假信号,提高信号质量,从而减少不必要的交易,降低交易频率。具体优势如下:
- 快慢RSI组合使用,识别短中长期超买超卖点,提高信号准确性
- 双重RSI过滤机制,有效减少噪音,避免被套
- 交易频率低,有助于降低交易成本和滑点损失
- 止损机制控制单笔损失和最大回撤
双层RSI策略也存在一定的风险,主要来源于以下几个方面:
- RSI本身的滞后性可能带来交易延迟
- 双重过滤机制可能错过部分交易机会
- 不能完全避免极端行情的系统性风险
可以通过以下方法降低上述风险:
- 适当调整快速RSI的参数,增加敏感性
- 优化开仓和止损条件,平衡风险和收益
- 与趋势系统、机器学习等算法组合使用
双层RSI策略还有进一步优化的空间,主要方向包括:
- 动态优化RSI参数,根据市场环境自动调整
- 增加基于波动率的风险控制模块
- 结合文本分析、社交数据等替代信号
- 使用机器学习模型辅助过滤信号
通过上述优化,可以进一步提升策略的盈利能力、稳健性与适应性。
双层RSI策略整体而言是一个非常实用的量化交易策略。它融合了趋势跟踪、超买超卖识别与双重过滤等机制,形成了一套相对完整的交易体系。该策略在控制风险、降低交易频率等方面表现突出,适合中长期持有。通过持续优化与迭代,双层RSI策略有望成为新一代量化策略的重要组成部分。
||
The Double Decker RSI trading strategy is a quantitative trading strategy based on the Relative Strength Index (RSI). This strategy utilizes both fast and slow RSI as trading signals to achieve double confirmation and aims to improve signal quality and filter out false signals.
This strategy employs two RSI with different periods as the main trading indicators. The fast RSI has a period of 5 days and is used to capture short-term overbought and oversold situations. The slow RSI has a period of 14 days and is used to determine the medium to long term trend and key support/resistance levels.
The specific trading rules are:
-
When the fast RSI crosses above 70 and the slow RSI is above 50, go long. When the fast RSI crosses below 30 and the slow RSI is below 50, go short.
-
The stop loss for long positions is when the fast RSI crosses below 55. The stop loss for short positions is when the fast RSI crosses above 45.
By combining fast and slow RSI, this strategy achieves complementarity between different timeframes, and can effectively identify overbought/oversold conditions while confirming the medium to long term trend, thus generating high quality trading signals. The double RSI filter mechanism also helps reduce false breakout noises.
The biggest advantage of the Double Decker RSI strategy is that it can effectively filter out false signals and improve signal quality, thus reducing unnecessary trades and lowering trading frequency. The specific advantages are:
-
The combination of fast and slow RSI identifies short, medium and long-term overbought/oversold points, improving signal accuracy.
-
The double RSI filter mechanism effectively reduces noise and avoids being trapped.
-
Low trading frequency helps reduce transaction costs and slippage loss.
-
The stop loss mechanism controls single loss and maximum drawdown.
The Double Decker RSI strategy also carries certain risks, mainly from the following aspects:
-
The lagging nature of RSI itself may cause trade delay.
-
The double filter mechanism may miss some trading opportunities.
-
It cannot completely avoid systemic risks in extreme market conditions.
The following methods can be used to mitigate the above risks:
-
Appropriately adjust the parameters of the fast RSI to increase sensitivity.
-
Optimize entry and stop loss conditions to balance risk and return.
-
Use in combination with trend-following systems, machine learning algorithms etc.
There is still room for further optimization of the Double Decker RSI strategy, mainly in the following directions:
-
Dynamic optimization of RSI parameters to automatically adjust based on market conditions.
-
Add a volatility-based risk control module.
-
Incorporate alternative signals like text mining, social data etc.
-
Use machine learning models to assist in filtering signals.
Through the above optimizations, the strategy's profitability, robustness and adaptiveness can be further improved.
In general, the Double Decker RSI strategy is a very practical quantitative trading strategy. It combines trend tracking, overbought/oversold identification, and dual filtering mechanisms to form a relatively complete trading system. This strategy performs remarkably in controlling risk and reducing trading frequency, making it suitable for medium to long term holding. With continuous optimization and iteration, the Double Decker RSI strategy has the potential to become an important component of next-generation quantitative strategies.
[/trans]
Strategy Arguments
| Argument | Default | Description |
|---|---|---|
| v_input_1 | 14 | Slow RSI Period |
| v_input_2 | 5 | Fast RSI Period |
| v_input_3 | 2000 | Backtest Start Year |
| v_input_4 | 2021 | Backtest End Year |
Source (PineScript)
/*backtest
start: 2023-12-30 00:00:00
end: 2024-01-29 00:00:00
period: 1h
basePeriod: 15m
exchanges: [{"eid":"Futures_Binance","currency":"BTC_USDT"}]
*/

// This source code is subject to the terms of the Mozilla Public License 2.0 at https://mozilla.org/MPL/2.0/
// © Ankit_Quant
//@version=4

// ********************************************************************************************************
// This was coded live during webinar on Backtesting in Tradingview
// That was held on 16-Jan-21
// Aim of this strategy is to code a Double Decker RSI Strategy - Rules of Strategy are given in Description
// *********************************************************************************************************

// Identifier of strategy or an indicator (study())
strategy(title="Strategy- Double Decker RSI",shorttitle='Strategy - Double Decker RSI',overlay=true)

// ********************
// INPUTS
// ********************
// RSI Lookback Periods
slowRSI=input(defval=14,title='Slow RSI Period',type=input.integer)
fastRSI=input(defval=5,title='Fast RSI Period',type=input.integer)

// Time Period Backtesting Input
start_year=input(defval=2000,title='Backtest Start Year',type=input.integer)
end_year=input(defval=2021,title='Backtest End Year',type=input.integer)

//Specific Years to Test Starategy
timeFilter=true


// Trade Conditions and signals
long = rsi(close,fastRSI)>70 and rsi(close,slowRSI)>50
short = rsi(close,fastRSI)<40 and rsi(close,slowRSI)<50
long_exit=rsi(close,fastRSI)<55
short_exit=rsi(close,fastRSI)>45

//positionSize - 1 Unit (also default setting)
positionSize=1

// Trade Firing - Entries and Exits
if(timeFilter)
    if(long and strategy.position_size<=0)
        strategy.entry(id='Long',long=strategy.long,qty=positionSize)
    if(short and strategy.position_size>=0)
        strategy.entry(id="Short",long=strategy.short,qty=positionSize)
    if(long_exit and strategy.position_size>0)
        strategy.close_all(comment='Ex')
    if(short_exit and strategy.position_size<0)
        strategy.close_all(comment='Ex')


// Plot on Charts the Buy Sell Labels
plotshape(strategy.position_size<1 and long,style=shape.labelup,location=location.belowbar,color=color.green,size=size.tiny,text='Long',textcolor=color.white)
plotshape(strategy.position_size>-1 and short,style=shape.labeldown,location=location.abovebar,color=color.red,size=size.tiny,text='Short',textcolor=color.white)
plotshape(strategy.position_size<0 and short_exit?1:0,style=shape.labelup,location=location.belowbar,color=color.maroon,size=size.tiny,text='ExShort',textcolor=color.white)
plotshape(strategy.position_size>0 and long_exit?1:0,style=shape.labeldown,location=location.abovebar,color=color.olive,size=size.tiny,text='ExLong',textcolor=color.white)
Detail
https://www.fmz.com/strategy/440428
Last Modified
2024-01-30 15:21:47
