Name
双均线智能追踪策略Dual-Moving-Average-Intelligent-Tracking-Strategy
Author
ChaoZhang
Strategy Description
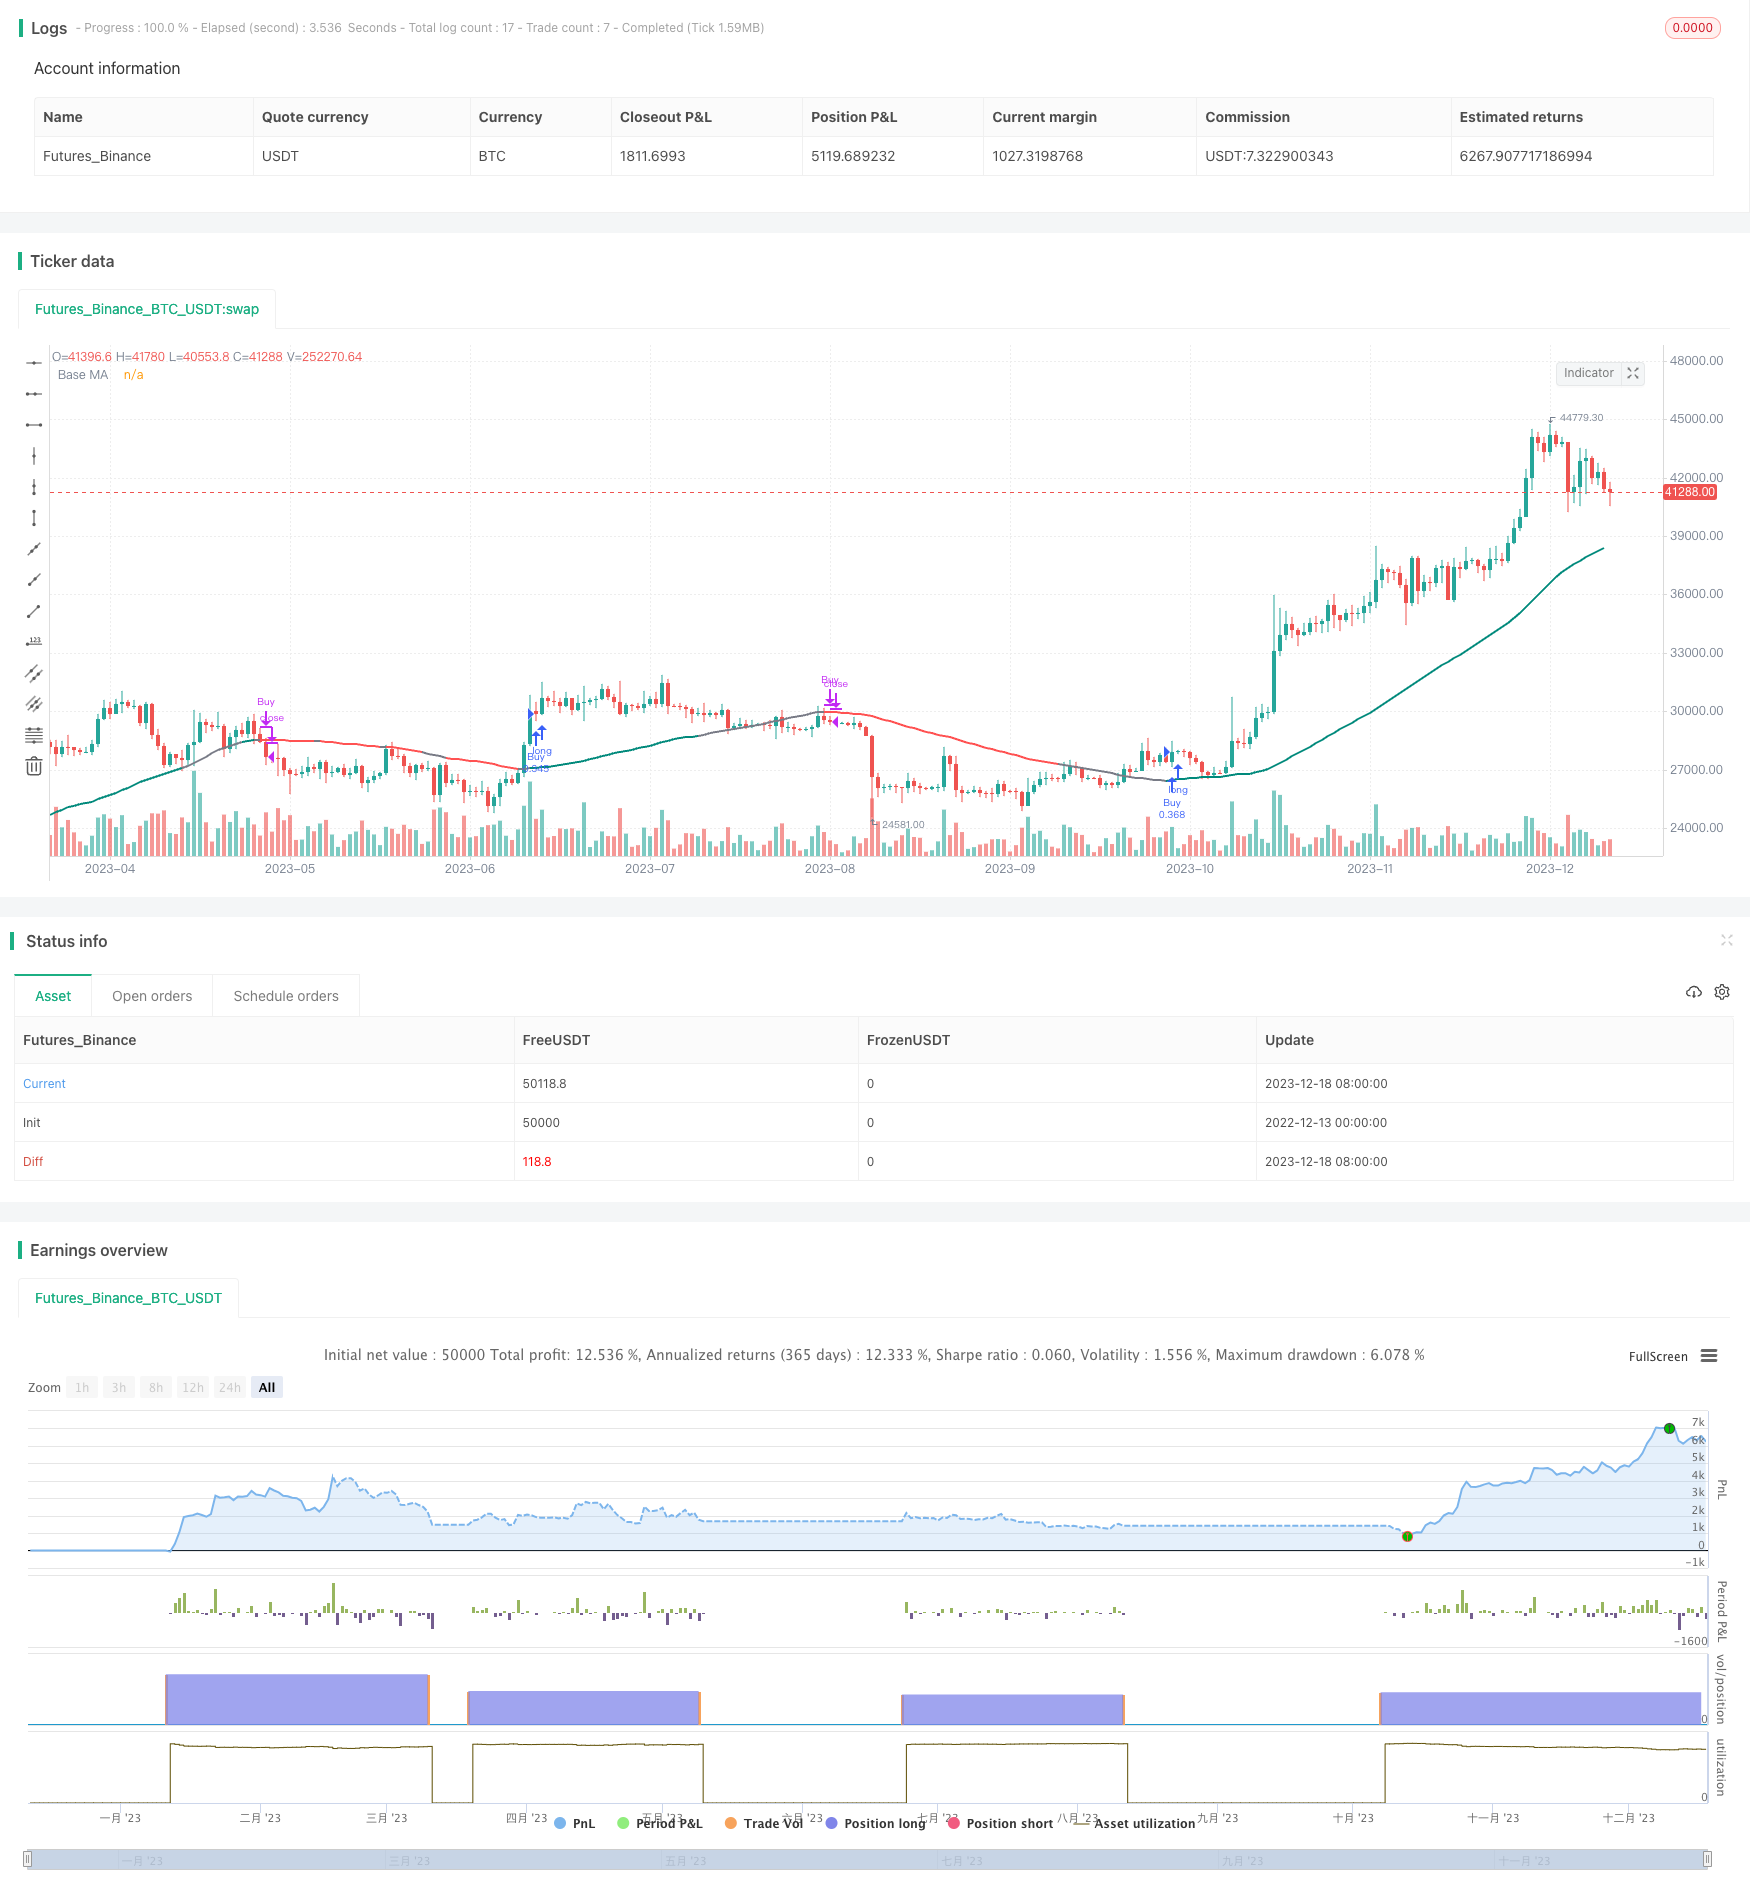
双均线智能追踪策略运用双均线指标追踪短期和中长期价格趋势,在追踪时通过颜色和线宽变化形成视觉辅助,帮助交易者直观判断市场走势并据此建仓做空。该策略运用自定义参数实现了高度灵活性,适合有一定技术基础的私募基金和对冲基金进行程序化交易。
双均线智能追踪策略的核心在于运用快速移动平均线和慢速移动平均线生成交易信号。具体来说,快速移动平均线追踪短期价格变化,慢速移动平均线反映中长期趋势。同时,策略通过三种颜色方案(交叉、方向和综合)使基准移动平均线呈现不同颜色,辅助判断市场走势。当快速均线上穿慢速均线时采取看涨操作;当快速均线下穿慢速均线时平仓做空。此外,基准移动平均线可自定义长度,颜色选项可在交叉、方向和综合之间切换,实现高度定制化。
双均线智能追踪策略最大的优势在于结合双均线指标和颜色视觉辅助判断市场走势,操作简单清晰。其次,该策略参数可自定义,用户可以根据自己的交易偏好和市场环境进行调整,实现高效回测和实盘交易。再次,不同颜色方案可以满足不同用户的视觉和操作习惯。最后,双均线追踪价格变化灵敏度高,可以抓住短期价格波动的机会。
虽然双均线智能追踪策略优势明显,但也存在一些潜在风险。双均线对价格变化高度敏感,容易产生虚假信号导致过度交易。此外,自定义参数虽灵活但也增加了调参难度,不恰当参数组合会影响策略盈利能力。对冲基金和私募基金需要警惕追涨杀跌现象,合理控制仓位规模。最后,用户需要对双均线指标和移动平均线有足够了解,否则难以合理运用该策略。
双均线智能追踪策略还有几个可优化的方向。第一,可以引入附加指标过滤误导信号,如KDJ指标判断超买超卖,MACD判断获利回撤。第二,建立参数优化模型,辅助用户选择最优参数组合。第三,运用机器学习模型预测价格变化,辅助双均线判断走势方向。第四,开发止损机制,在亏损达到预设条件时自动平仓。这些优化可以提高策略稳定性和盈利空间。
双均线智能追踪策略整体而言是一种优势明显而简单灵活的高频程序化交易策略。它巧妙地融合双均线指标和颜色视觉辅助判断市场,可以抓住短期价格波动获利。同时该策略高度可定制,适合有一定量化交易基础的投资者和基金进行策略优化和参数调整后实盘运用。当然,我们也需要警惕其中的一些风险,如自定义参数调整难度较大,以及双均线指标容易产生误导信号等。通过引入辅助判断指标、建立参数选择模型、预测价格变化趋势等方法,该策略还具有较大的优化潜力,值得深度探索。
||
The Dual Moving Average Intelligent Tracking strategy utilizes the dual moving average indicator to track short-term and medium-to-long term price trends. Visual aids in the form of color changes and line width transformations help traders intuitively judge market trends and make trading decisions accordingly. The strategy offers high flexibility through customizable parameters, making it suitable for algorithmic trading by hedge funds and private equity funds with some technical sophistication.
The core of the Dual Moving Average Intelligent Tracking strategy lies in using fast and slow moving averages to generate trading signals. Specifically, the fast moving average tracks short-term price fluctuations, while the slow one reflects medium-to-long term trends. Additionally, the strategy presents the baseline moving average in different colors based on three schemes (Crossover, Direction, and Composite) to assist in determining market trends. Long positions are initiated when the fast MA crosses over the slow MA, and exits when the fast MA crosses below. The length of the baseline MA is customizable, and the color scheme can be switched among the three options to allow a high degree of customization.
The biggest advantage of this strategy is the combination of the dual moving average indicator and visual aids using colors to judge market trends, making it simple and straightforward to operate. Next, the customizable parameters empower users to tailor the strategy based on their trading preferences and market conditions, enabling efficient backtesting and live trading. The choice of color schemes can also cater to different users' visual and operational habits. Lastly, the dual MAs are responsive in tracking price changes, allowing the strategy to capitalize on short-term price swings.
Despite its conspicuous advantages, the strategy also carries some potential risks. The dual MAs are highly sensitive to price fluctuations, which may generate false signals and lead to overtrading. While flexibility rises with customizable parameters, difficulty in parameter tuning also increases, and inappropriate parameter combinations will undermine profitability. Hedge funds and private equity funds need to be wary of chasing trends and over leveraging. Finally, users require sufficient comprehension of dual MAs and moving averages to apply the strategy appropriately.
Several optimization pathways exist for the strategy. Firstly, additional indicators can be introduced to filter misleading signals, like KDJ for overbought-oversold levels and MACD for profitable pullbacks. Secondly, a parameter optimization model can be constructed to aid parameter selection. Thirdly, machine learning models can be leveraged to forecast price changes and assist trend judgement. Fourthly, a stop loss mechanism can be instituted to automatically exit positions when losses reach preset thresholds. These optimizations can enhance the strategy's stability and profitability.
On the whole, the Dual Moving Average Intelligent Tracking Strategy is a simple yet flexible, advantage-rich high frequency algorithmic trading approach. It cleverly fuses dual moving averages and visual aids to determine market trends and capitalize on short-term swings. Meanwhile, its high customizability makes it suitable for optimization and parameter tuning by knowledgeable investors and funds before real-world application. Nonetheless, risks like tuning difficulty and misleading signals should be heeded. Further optimizations around additional indicators, parameter selection models, price change forecasts, etc. can unlock greater potential. Hence, this strategy warrants in-depth exploration. [/trans]
Strategy Arguments
| Argument | Default | Description |
|---|---|---|
| v_input_int_1 | 50 | Base MA Length |
| v_input_string_1 | 0 | MA Type: SMA |
| v_input_string_2 | 0 | Color Option: Composite |
| v_input_int_2 | 10 | (?For Crossover Color Option)Fast MA Length |
| v_input_int_3 | 30 | Slow MA Length |
| v_input_int_4 | 1975 | (?Date Range)Start Year |
| v_input_int_5 | true | Start Month |
| v_input_int_6 | true | Start Day |
| v_input_int_7 | 2099 | End Year |
| v_input_int_8 | 12 | End Month |
| v_input_int_9 | 31 | End Day |
Source (PineScript)
/*backtest
start: 2022-12-13 00:00:00
end: 2023-12-19 00:00:00
period: 1d
basePeriod: 1h
exchanges: [{"eid":"Futures_Binance","currency":"BTC_USDT"}]
*/

// © Julien_Eche

//@version=5
strategy("Smart MA Strategy", shorttitle="Smart MA Strategy", overlay=true, default_qty_type=strategy.percent_of_equity, default_qty_value=20)

// Input parameters
base_ma_length = input.int(50, title="Base MA Length")
ma_type = input.string("SMA", title="MA Type", options=["SMA", "WMA", "EMA"])
color_choice = input.string("Composite", title="Color Option", options=["Crossover", "Direction", "Composite"])
fast_length = input.int(10, title="Fast MA Length", group="For Crossover Color Option")
slow_length = input.int(30, title="Slow MA Length", group="For Crossover Color Option")

// Start and end date inputs
start_year = input.int(1975, title="Start Year", group="Date Range")
start_month = input.int(1, title="Start Month", group="Date Range")
start_day = input.int(1, title="Start Day", group="Date Range")
end_year = input.int(2099, title="End Year", group="Date Range")
end_month = input.int(12, title="End Month", group="Date Range")
end_day = input.int(31, title="End Day", group="Date Range")

// Calculate the selected MAs
fast_ma = ta.sma(close, fast_length)
slow_ma = ta.sma(close, slow_length)

// Calculate the base MA with the specified length
base_ma = ta.sma(close, base_ma_length)

// Determine if the base MA is increasing or decreasing
base_ma_increasing = base_ma > base_ma[1]

// Define the color for the base MA based on the selected option
base_ma_color =    color_choice == "Direction" ? (base_ma_increasing ? color.teal : color.red) :    color_choice == "Crossover" ? (fast_ma > slow_ma ? color.teal : color.red) :    color_choice == "Composite" ? (base_ma_increasing and fast_ma > slow_ma ? color.teal : not base_ma_increasing and fast_ma < slow_ma ? color.red : color.gray) :    color.gray

// Plot the base MA with the specified color and linewidth
plot(base_ma, title="Base MA", color=base_ma_color, style=plot.style_line, linewidth=2)

// Define the start and end timestamps
start_date = timestamp(start_year, start_month, start_day, 0, 0)
end_date = timestamp(end_year, end_month, end_day, 23, 59)

// Filter strategy signals based on date
in_date_range = time >= start_date and time <= end_date

// Strategy conditions for each option
if (color_choice == "Composite" and in_date_range)
    if (base_ma_increasing and fast_ma > slow_ma)
        strategy.entry("Buy", strategy.long)
    if (not base_ma_increasing and fast_ma < slow_ma)
        strategy.close("Buy")

if (color_choice == "Crossover" and in_date_range)
    if (fast_ma > slow_ma)
        strategy.entry("Buy", strategy.long)
    if (fast_ma < slow_ma)
        strategy.close("Buy")

if (color_choice == "Direction" and in_date_range)
    if (base_ma_increasing)
        strategy.entry("Buy", strategy.long)
    if (not base_ma_increasing)
        strategy.close("Buy")
Detail
https://www.fmz.com/strategy/435953
Last Modified
2023-12-20 13:50:47
