Name
动量突破EMA-34交叉策略Momentum-Breakthrough-EMA-34-Crossover-Strategy
Author
ChaoZhang
Strategy Description
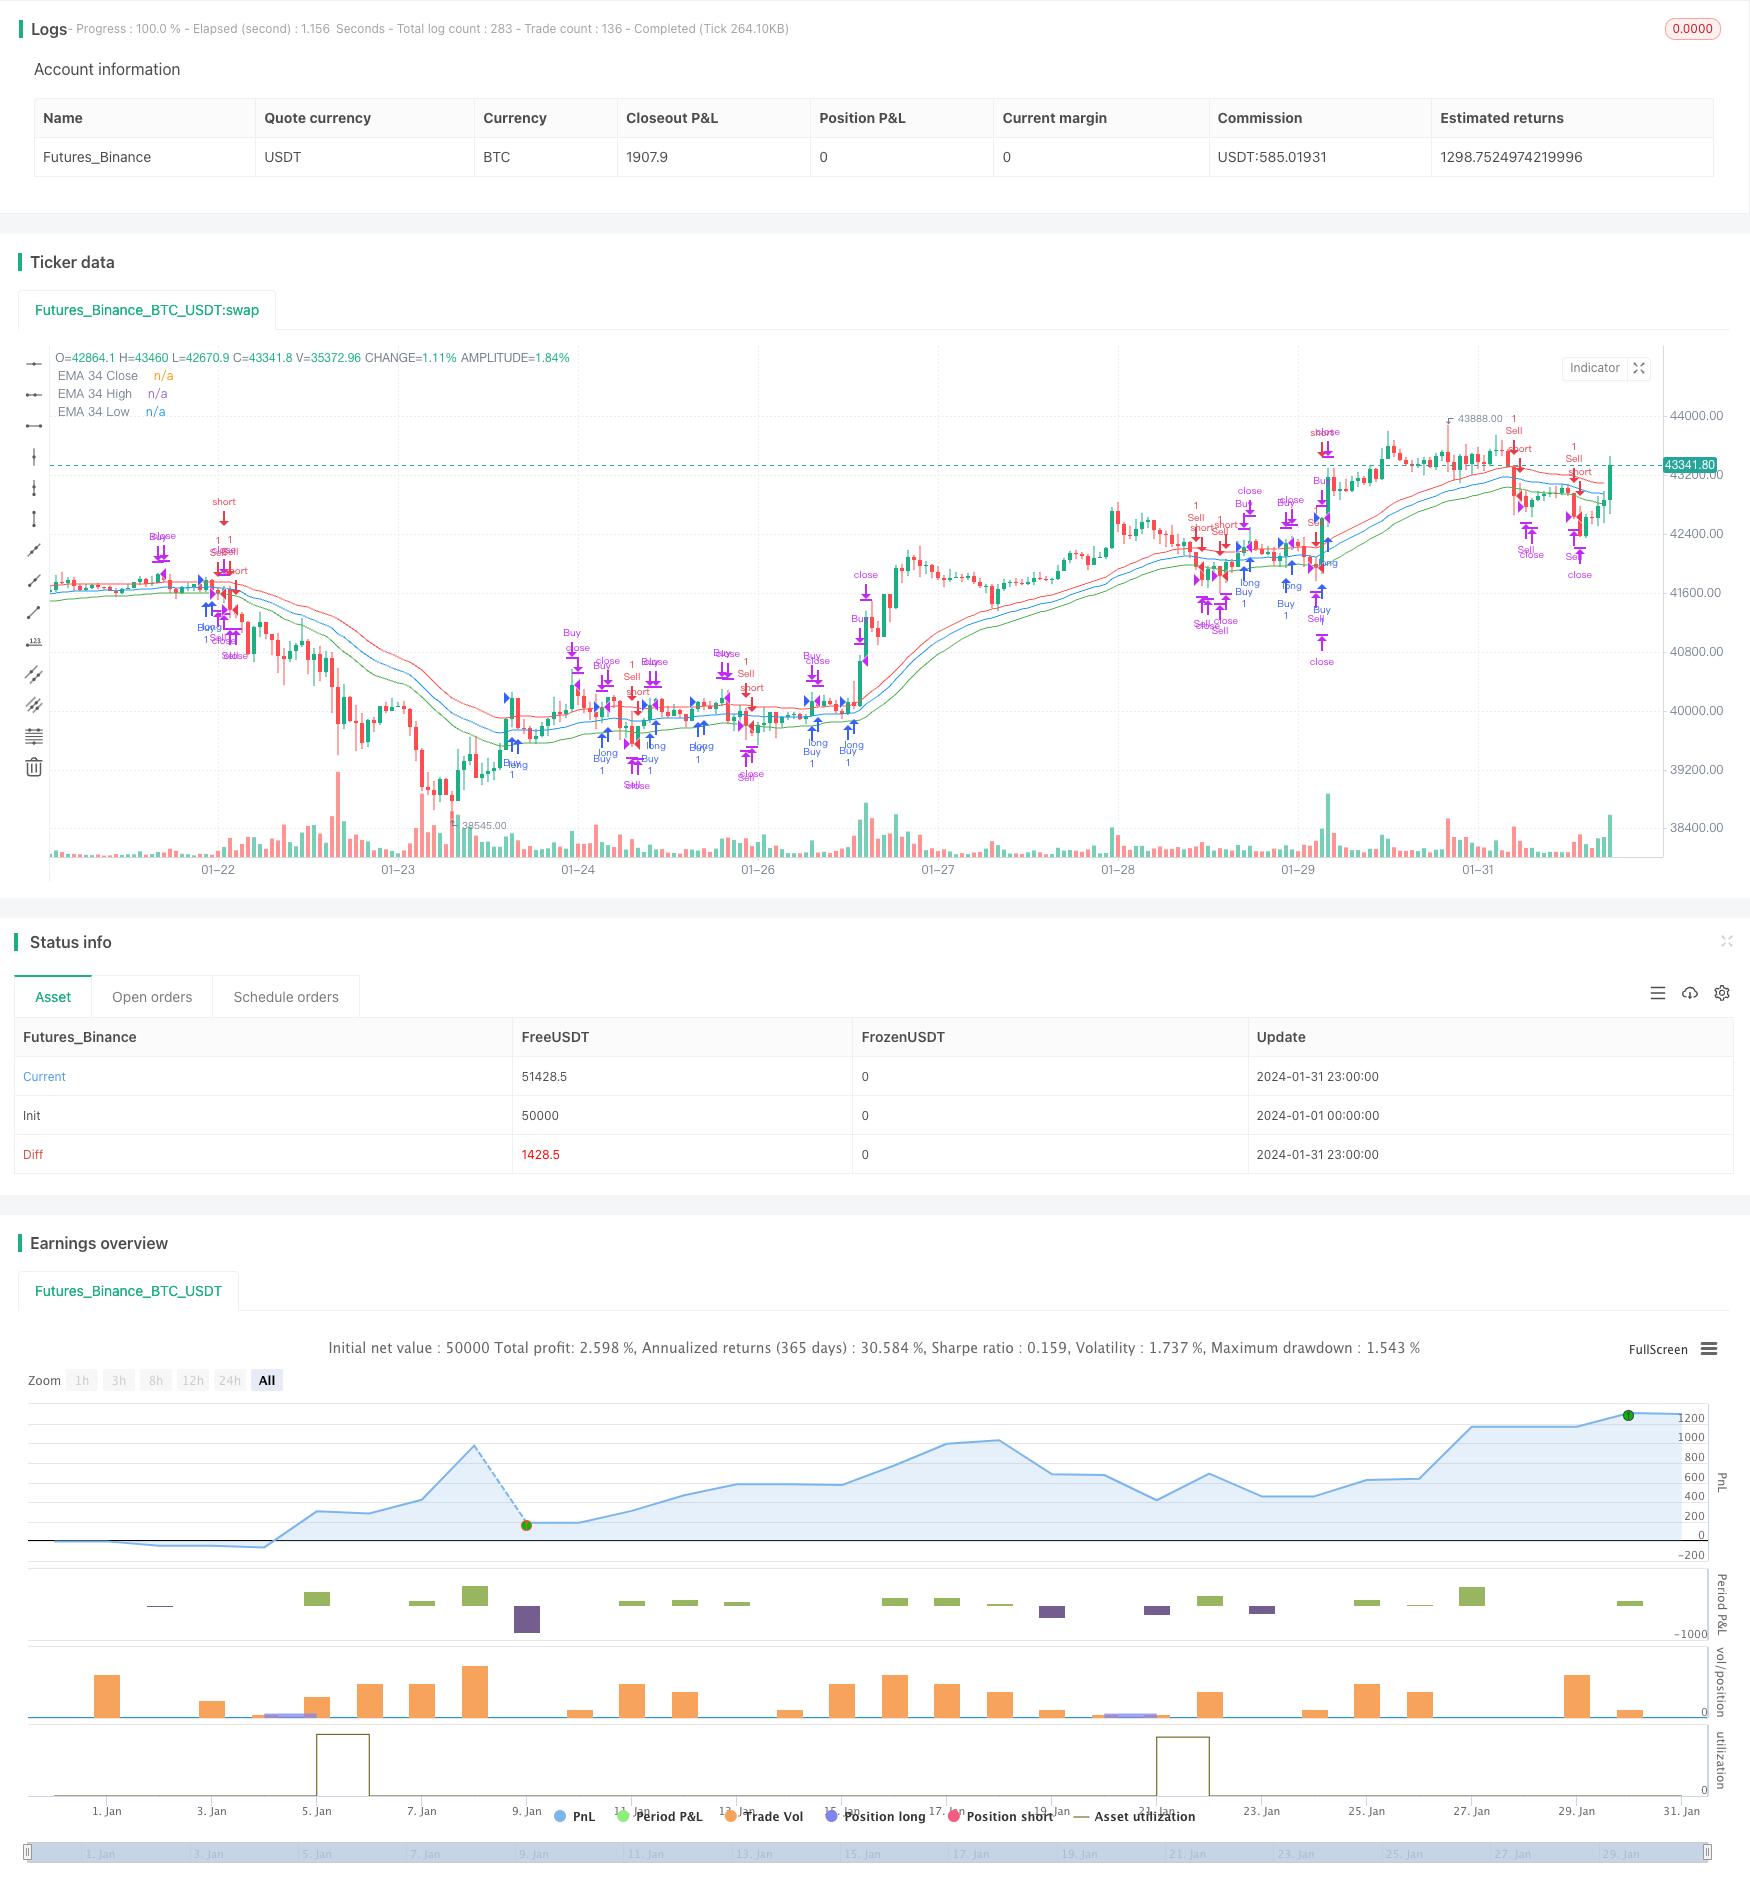
这个策略是基于EMA 34的动量交叉作为入场信号的趋势跟踪策略。它同时结合了价格破坏EMA动量线的突破信号和EMA 34均线的黄金交叉来产生交易信号。
该策略首先计算close, high, low的34周期的EMA均线,分别取名为emaClose, emaHigh, emaLow。然后它根据价格是否突破emaHigh和emaLow的情况来产生买入和卖出信号。
具体来说,当close价格超过emaHigh时,产生买入信号;当close价格低于emaLow时,产生卖出信号。一旦产生信号,就以当时的close价格入场,并设置止盈为100点,止损为50点。
这样,该策略就利用EMA 34的动量指标来捕捉市场的趋势,实现趋势跟踪。
该策略最大的优势在于同时结合了均线的黄金交叉信号和价格的突破信号,使得入场时点更加准确,可以有效过滤假信号。此外,EMA作为一种趋势跟踪工具,可以帮助策略及时捕捉市场趋势,实现趋势跟踪交易。
该策略的主要风险在于容易产生多头连续亏损的情况。当行情出现较短的调整震荡后再启动 neue 上涨趋势时,该策略可能会频繁减仓亏损。此外,作为趋势跟踪策略,它无法很好地在盘整行情中获利。
可以通过适当调整止损点,或增加其他指标来进行优化,提高策略的胜率。
该策略可以从以下几个方向进行优化:
-
增加其他指标过滤,例如加入成交量指标,避免在假突破中被套。
-
优化EMA周期参数,调整为更适合该品种的周期参数。
-
采用类似盈亏比这类退出机制,而不是简单的止盈止损点,可以提高策略的稳定性。
-
增加流动性过滤,避免交易流动性差的时段,可以减少滑点损失。
本策略作为一个基于EMA动量指标的趋势跟踪策略,具有较高的实用性。它同时结合价格突破信号和EMA的黄金交叉信号,可以有效发现新的趋势方向。通过一定的参数和退出机制优化后,可以进一步增强策略稳定性。
||
This strategy is a trend-following strategy based on the momentum crossover of EMA 34 as the entry signal. It combines the breakthrough signals of price breaking through the EMA momentum line and the golden cross of EMA 34 to generate trading signals.
The strategy first calculates the 34-period EMA lines of close, high, low, named as emaClose, emaHigh, emaLow respectively. Then it generates buy and sell signals according to whether the price breaks through emaHigh and emaLow.
Specifically, when the close price exceeds emaHigh, a buy signal is generated; when the close price is below emaLow, a sell signal is generated. Once the signal is generated, enter at the close price at that time, and set the take profit to 100 points and the stop loss to 50 points.
In this way, the strategy uses the momentum indicator of EMA 34 to capture the trend of the market and implement trend following.
The biggest advantage of this strategy is that it combines both the golden cross signal of the moving average and the breakthrough signal of the price, which makes the entry point more accurate and can effectively filter false signals. In addition, as a trend-following tool, EMA can help the strategy capture market trends in a timely manner to implement trend trading.
The main risk of this strategy is that it is prone to consecutive long losses. When the market has a short adjustment shock before starting a neue uptrend, this strategy may frequently reduce positions at a loss. In addition, as a trend-following strategy, it cannot profit well in a sideways market.
Optimization can be achieved by appropriately adjusting the stop loss point, or adding other indicators to improve the win rate of the strategy.
The strategy can be optimized in the following directions:
-
Add other indicators for filtering, such as adding a volume indicator to avoid being trapped in false breakouts.
-
Optimize the EMA cycle parameters and adjust them to cycle parameters more suitable for the variety.
-
Use an exit mechanism like profit factor instead of simple take profit and stop loss points to improve the stability of the strategy.
-
Increase liquidity filtering to avoid trading in periods with poor liquidity, which can reduce slippage losses.
As a trend-following strategy based on EMA momentum indicators, this strategy has high practical utility. By combining price breakthrough signals and EMA golden cross signals, it can effectively discover neue trend directions. After a certain parameter and exit mechanism optimization, the stability of the strategy can be further enhanced. [/trans]
Source (PineScript)
/*backtest
start: 2024-01-01 00:00:00
end: 2024-01-31 23:59:59
period: 1h
basePeriod: 15m
exchanges: [{"eid":"Futures_Binance","currency":"BTC_USDT"}]
*/

//@version=5
strategy("EMA 34 Crossover Strategy_4", overlay=true)

length = 34
exitPoints = 50

emaClose = ta.ema(close, length)
emaHigh = ta.ema(high, length)
emaLow = ta.ema(low, length)

var float[] entryPrices = array.new_float()
var float[] exitLevels = array.new_float()

// Long entry condition: Price crosses above EMA 34 high
enterLong = ta.crossover(close, emaHigh)

// Short entry condition: Price crosses below EMA 34 low
enterShort = ta.crossunder(close, emaLow)

// Exit condition for both long and short trades
exitLong = array.size(entryPrices) > 0 ? close >= array.get(entryPrices, array.size(entryPrices) - 1) + exitPoints : false
exitShort = array.size(entryPrices) > 0 ? close <= array.get(entryPrices, array.size(entryPrices) - 1) - exitPoints : false

if (enterLong)
    array.push(entryPrices, close)
    array.push(exitLevels, close + exitPoints)
    strategy.entry("Buy", strategy.long)

if (enterShort)
    array.push(entryPrices, close)
    array.push(exitLevels, close - exitPoints)
    strategy.entry("Sell", strategy.short)

if (exitLong)
    strategy.close("Buy")

if (exitShort)
    strategy.close("Sell")

plot(emaClose, color=color.blue, title="EMA 34 Close")
plot(emaHigh, color=color.red, title="EMA 34 High")
plot(emaLow, color=color.green, title="EMA 34 Low")
Detail
https://www.fmz.com/strategy/442847
Last Modified
2024-02-26 15:05:18