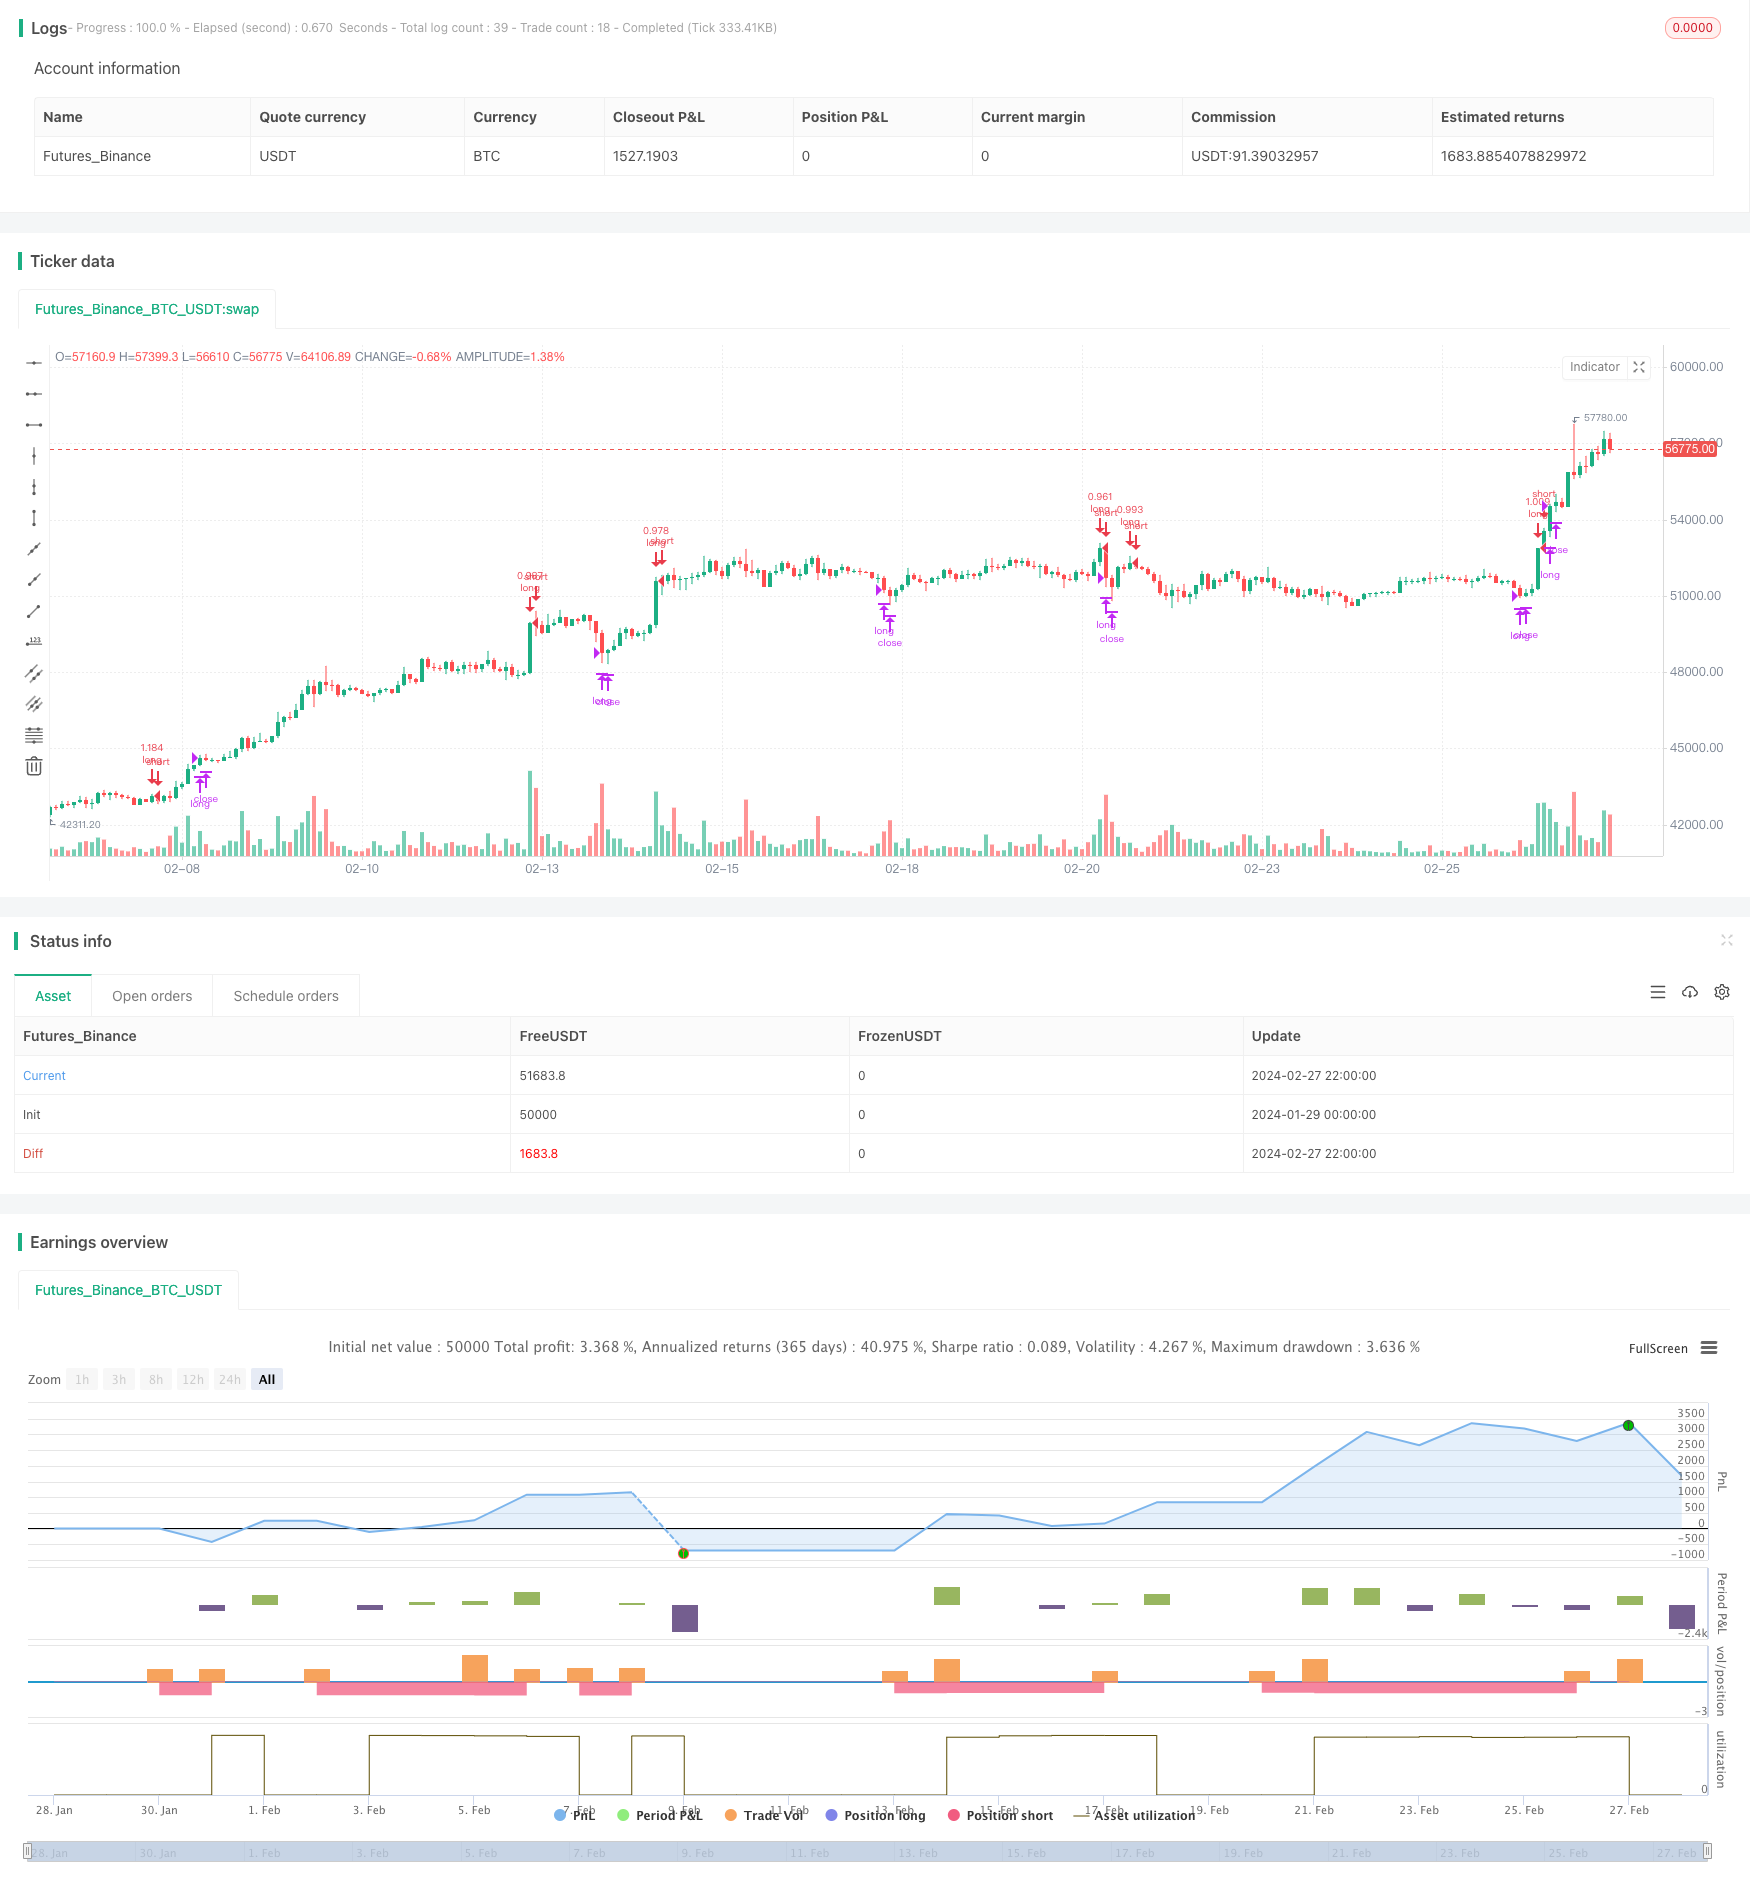
Name
动量指标与移动平均线结合做多策略Momentum-and-Moving-Average-Combination-Long-Strategy
Author
ChaoZhang
Strategy Description
本策略结合MACD动量指标和DMI趋向指标,在符合条件时进行做多操作。其 exits设置了固定止盈和自定义的波动性 trailing stop来锁定收益。
该策略的 entries 依赖 MACD 和 DMI 指标:
- MACD 为正(MACD 线高于Signal线)时,表示市场上涨动能增强
- DMI中的DI+高于DI- 时,表示市场处于趋势向上阶段
当上述两个条件同时满足时,做多开仓。
Position exits 则有两个标准:
- 固定止盈:close 价格涨幅达到设置的百分比时止盈
- 波动性追踪止损:使用 ATR 和最近最高价计算出一个动态调整的止损位置。这个可以根据市场波动性来 trailing stop loss
- MACD 和 DMI 的结合可以比较可靠地判断市场的趋势方向,减少错误的操作
- 止盈条件结合了固定止盈和波动性止损,可以灵活锁定利润
- MACD 和 DMI 都可能产生假信号,导致不必要的亏损
- 固定止盈可能让利润无法最大化
- 波动性止损的 trails 速度可能调整不当,过于激进或保守
- 可以考虑加入其它指标过滤入场信号,例如利用 KDJ 指标判断是否过超买过超卖
- 可以测试不同的参数以获得更好的止盈止损效果
- 可以根据具体交易品种调整移动平均线等参数,优化系统
本策略综合多个指标判断市场趋势和条件,在较大概率利好情况下介入。止盈条件也做了优化设计,在保证一定利润的同时也考虑了收益锁定的灵活性。通过参数调整以及进一步的风险管理,本策略可以成为一个稳定输出的量化交易系统。
||
This strategy combines the MACD momentum indicator and the DMI trend indicator to go long when conditions are met. Its exits set a fixed take profit and a custom volatility trailing stop to lock in profits.
The entries of this strategy rely on the MACD and DMI indicators:
- When MACD is positive (MACD line above Signal line), it indicates strengthening upside momentum in the market
- When DI+ is higher than DI- in DMI, it indicates the market is in an uptrend
When both conditions are met at the same time, go long.
There are two standards for position exits:
- Fixed take profit: close price rises to a set percentage for profit taking
- Volatility trailing stop loss: use ATR and recent highest price to calculate a dynamically adjusted stop loss position. This can trailing stop loss according to market volatility
- The combination of MACD and DMI can more reliably determine the trend direction of the market and reduce erroneous operations
- The profit taking conditions combine fixed take profit and volatility stop loss, which can flexibly lock in profits
- Both MACD and DMI may produce false signals, leading to unnecessary losses
- Fixed take profit may prevent profits from being maximized
- The trailing speed of volatility stops may be improperly adjusted, too aggressive or conservative
- Consider adding other indicators to filter entry signals, such as using the KDJ indicator to determine whether it is overbought or oversold
- Different parameters can be tested for better take profit and stop loss effects
- Parameters such as moving averages can be adjusted according to specific trading varieties to optimize the system
This strategy synthesizes multiple indicators to judge market trends and conditions, and intervenes in situations with a relatively large probability of favor. The profit taking conditions have also been optimally designed to ensure a certain profit while considering the flexibility of locking in gains. Through parameter adjustment and further risk management, this strategy can become a stable quantitative trading system.
[/trans]
Strategy Arguments
| Argument | Default | Description |
|---|---|---|
| v_input_1 | true | From Month |
| v_input_2 | true | From Day |
| v_input_3 | 2021 | From Year |
| v_input_4 | true | Thru Month |
| v_input_5 | true | Thru Day |
| v_input_6 | 2112 | Thru Year |
| v_input_7 | true | Show Date Range |
| v_input_8 | 3 | v_input_8 |
| v_input_9 | 20 | Length |
| v_input_10_close | 0 | Source: close |
| v_input_11 | 2 | vStop Multiplier |
Source (PineScript)
/*backtest
start: 2024-01-29 00:00:00
end: 2024-02-28 00:00:00
period: 2h
basePeriod: 15m
exchanges: [{"eid":"Futures_Binance","currency":"BTC_USDT"}]
*/

// This source code is subject to the terms of the Mozilla Public License 2.0 at https://mozilla.org/MPL/2.0/
//@version=4
strategy(shorttitle='(MACD + DMI Scalping with Volatility Stop',title='MACD + DMI Scalping with Volatility Stop by (Coinrule)', overlay=true, initial_capital = 100, process_orders_on_close=true, default_qty_type = strategy.percent_of_equity, default_qty_value = 100, commission_type=strategy.commission.percent, commission_value=0.1)

// Works better on 3h, 1h, 2h, 4h

//Backtest dates
fromMonth = input(defval = 1,    title = "From Month",      type = input.integer, minval = 1, maxval = 12)
fromDay   = input(defval = 1,    title = "From Day",        type = input.integer, minval = 1, maxval = 31)
fromYear  = input(defval = 2021, title = "From Year",       type = input.integer, minval = 1970)
thruMonth = input(defval = 1,    title = "Thru Month",      type = input.integer, minval = 1, maxval = 12)
thruDay   = input(defval = 1,    title = "Thru Day",        type = input.integer, minval = 1, maxval = 31)
thruYear  = input(defval = 2112, title = "Thru Year",       type = input.integer, minval = 1970)

showDate  = input(defval = true, title = "Show Date Range", type = input.bool)

start     = timestamp(fromYear, fromMonth, fromDay, 00, 00)        // backtest start window
finish    = timestamp(thruYear, thruMonth, thruDay, 23, 59)        // backtest finish window
window()  => true

// DMI and MACD inputs and calculations

[pos_dm, neg_dm, avg_dm] = dmi(14, 14)
[macd, macd_signal, macd_histogram] = macd(close, 12, 26, 9)


Take_profit= ((input (3))/100)

longTakeProfit = strategy.position_avg_price * (1 + Take_profit)

length = input(20, "Length", minval = 2)
src = input(close, "Source")
factor = input(2.0, "vStop Multiplier", minval = 0.25, step = 0.25)
volStop(src, atrlen, atrfactor) =>
    var max     = src
    var min     = src
    var uptrend = true
    var stop    = 0.0
    atrM        = nz(atr(atrlen) * atrfactor, tr)
    max         := max(max, src)
    min         := min(min, src)
    stop        := nz(uptrend ? max(stop, max - atrM) : min(stop, min + atrM), src)
    uptrend     := src - stop >= 0.0
    if uptrend != nz(uptrend[1], true)
        max    := src
        min    := src
        stop   := uptrend ? max - atrM : min + atrM
    [stop, uptrend]

[vStop, uptrend] = volStop(src, length, factor)


closeLong = close > longTakeProfit or crossunder(close, vStop)


//Entry
strategy.entry(id="long", long = true, when = crossover(macd, macd_signal) and pos_dm > neg_dm and window())


//Exit
strategy.close("long", when = closeLong and window())
Detail
https://www.fmz.com/strategy/443107
Last Modified
2024-02-29 11:57:18
