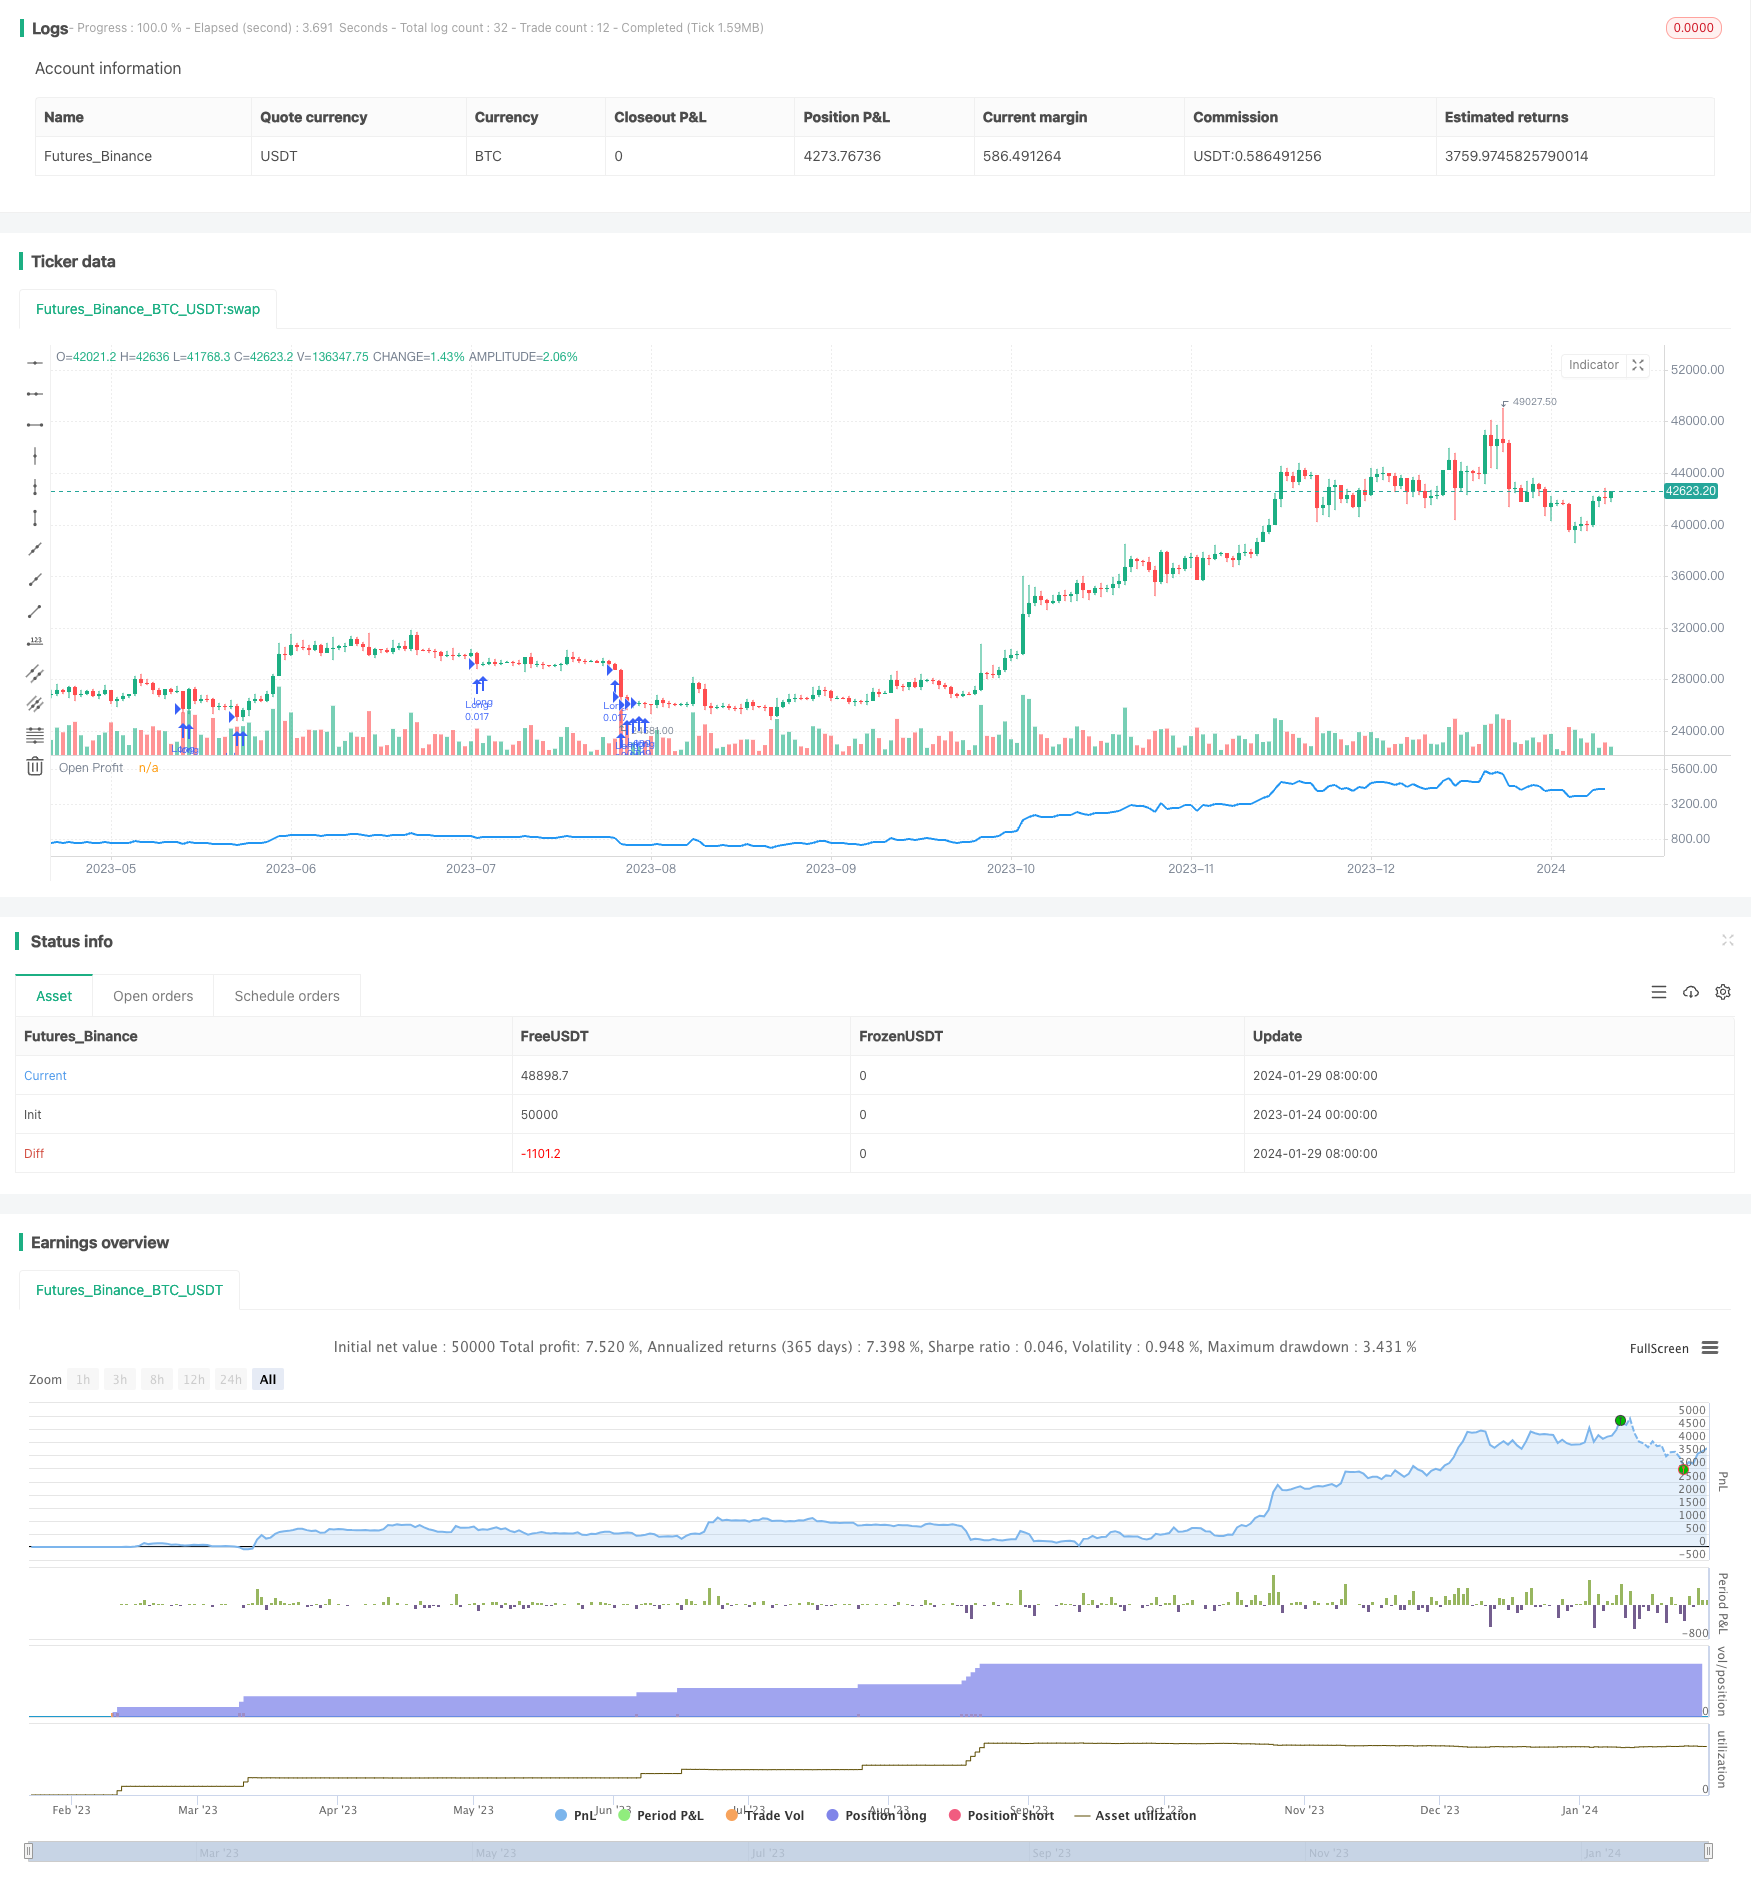
Name
动量布林带双均线DCA策略Momentum-Bollinger-Bands-Dual-Moving-Average-DCA-Strategy
Author
ChaoZhang
Strategy Description
动量布林带双均线DCA策略是一种低风险、长线持有的定投策略。它利用布林带指标判断价格是否跌破下轨,并结合RSI指标判断是否处于超卖区,以及双均线判断市场走势,在跌破布林带下轨且RSI低于50时定投买入,采用特定的资金规模,比如500美元。
该策略主要基于布林带指标和RSI指标,辅以双均线判断市场走势。布林带是根据正常分布统计理论计算股票价格相关性和波动率,构建出股票价格的区间范围。当价格跌破下轨时表示股票进入相对低价区域。RSI指标判断价格是否处于超卖区。双均线判断市场短期和中期走势。
该策略的交易逻辑是:当股票价格跌破布林带下轨,且RSI低于50时进行定投买入,表明股票处于相对低位且有一定反弹动能。双均线判断市场走势,可避免在市场持续下跌时仍然定投买入。
该策略最大的优势是风险较低且容易操作。采用定投策略,不需要关注具体的买入时机,只要符合条件就买入,降低了交易频率。布林带指标判断价格跌破下轨代表进入低价区,买入后的上涨空间较大。RSI低于50判断已经进入超卖区域,有望出现反弹。资金固定定投也控制了单次亏损的范围。
该策略的主要风险在于:1)无法确定市场底部,在股票市场大幅下跌时仍有亏损风险;2)RSI指标并不总是能判断超卖区的结束,价格可能继续下跌。3)定投策略需要定期投入资金,如果不能持续投入也会影响绩效。4)交易成本会对频繁小额交易产生一定影响。
为了控制风险,选择指数ETF等相对低风险资产进行操作。避免在整体大盘处于下跌通道时过于频繁买入。也可以考虑调整RSI参数以尽量筛选超卖区结束的时机点。
该策略可以从以下几个方面进行优化:
-
采用更多指标判断买入时机。例如增加MACD、KD指标等判断是否处于超卖区域。
-
增加止损策略。当价格继续下跌一定幅度时止损离场,避免过度亏损。
-
调整布林带参数。当市场波动加大时,可以适当扩大布林带通道,避免过于频繁买入。
-
结合交易量指标。例如能量潮指标,避免在低量区域买入。
-
采用算法自动优化RSI参数。让RSI参数实时更新以尽量判断超卖区域结束点。
动量布林带双均线DCA策略整合了布林带判断价格相对低位、RSI判断超卖区以及双均线判断市场走势,实现了低风险的定投买入策略。相比其他定投策略,该策略更加关注买入时机选择。虽然无法完全避免亏损,但损失幅度有限,且长线持有收益较为可观。通过一些参数调整和优化指标,可以进一步降低交易风险、提高策略效率。
||
The Momentum Bollinger Bands Dual Moving Average DCA strategy is a low-risk, long-term holding dollar-cost averaging strategy. It uses the Bollinger Bands indicator to determine if the price has broken below the lower rail and the RSI indicator to determine if it is in the oversold area, combined with the dual moving average to judge the market trend. It buys in fixed amounts such as $500 when the price breaks below the Bollinger Bands lower rail and the RSI is below 50.
This strategy is mainly based on the Bollinger Bands and RSI indicators, supplemented by dual moving averages to determine market trends. Bollinger Bands are calculated based on normal distribution statistical theory to construct the price range of stocks. When the price breaks below the lower rail, it indicates that the stock has entered a relatively low price area. The RSI indicator determines whether the price is in the oversold area. The dual moving averages determine the short-term and medium-term market trends.
The trading logic of this strategy is: when the stock price breaks below the Bollinger Bands lower rail and the RSI is below 50, fixed amount is invested to buy in, indicating that the stock is at a relatively low level and has some rebound momentum. The dual moving average judges the market trend and avoids continued buying during persistent market declines.
The biggest advantage of this strategy is that it has relatively low risks and is easy to operate. By adopting a fixed investment strategy, there is no need to pay attention to specific entry timing. As long as the conditions are met, buying occurs, reducing trading frequency. The Bollinger Bands indicator determines that a break below the lower rail represents entering the low price area where the upside potential is greater after buying in. An RSI below 50 determines that it has entered the oversold zone and is likely to rebound. The fixed amount investment also controls the extent of a single loss.
The main risks of this strategy are: 1) Unable to determine the market bottom, there is still a risk of losses when the stock market plummets; 2) The RSI indicator does not always determine the end of the oversold area, and prices may continue to decline. 3) Fixed investment strategies require regular capital investment, which will also affect performance if it cannot be sustained. 4) Transaction costs will have some impact on frequent small transactions.
To control risks, relatively low-risk assets like index ETFs can be traded. Avoid buying too frequently when the overall market is in a downward channel. Consider adjusting RSI parameters to identify ending points of oversold zones.
This strategy can be optimized in the following aspects:
-
Use more indicators to determine entry timing. Such as adding MACD, KD and other indicators to determine if it is in the oversold area.
-
Add stop loss strategy. Stop loss when price continues to decline by a certain percentage to avoid excessive losses.
-
Adjust Bollinger Bands parameters. When market volatility increases, appropriately expand the Bollinger Bands channel to avoid excessive buying.
-
Incorporate trading volume indicators, such as the Chaikin Money Flow indicator, to avoid buys in low volume areas.
-
Adopt algorithm to automatically optimize RSI parameters, so that RSI parameters are updated in real time to better determine the end of the oversold area.
The Momentum Bollinger Bands Dual Moving Average DCA Strategy integrates Bollinger Bands to determine relatively low price levels, RSI to determine oversold areas, and dual moving averages to determine market trends, implementing a low-risk fixed investment buying strategy. Compared to other fixed investment strategies, this strategy pays more attention to the selection of entry timing. Although it is impossible to completely avoid losses, the extent of losses is limited, and long-term holding gains are relatively considerable. By adjusting some parameters and optimizing indicators, trading risks can be further reduced and strategy efficiency improved.
[/trans]
Strategy Arguments
| Argument | Default | Description |
|---|---|---|
| v_input_1 | 500 | Contribution (USD) |
| v_input_2 | 20 | Bollinger (Period) |
| v_input_3 | 2 | Deviations (Float) |
| v_input_4 | 14 | RSI (Period) |
Source (PineScript)
/*backtest
start: 2023-01-24 00:00:00
end: 2024-01-30 00:00:00
period: 1d
basePeriod: 1h
exchanges: [{"eid":"Futures_Binance","currency":"BTC_USDT"}]
*/

//@version=4
strategy("Bollinger DCA v1", overlay=false)

//user inputs
contribution = input(title="Contribution (USD)",type=input.integer,minval=1,maxval=1000000,step=1,defval=500,confirm=false)
length = input(title="Bollinger (Period)", defval=20, step=1, minval=1)
mult = input(title="Deviations (Float)", defval=2.0, step=0.001, minval=0.001, maxval=50)
rsi_period = input(title="RSI (Period)", defval=14, step=1, minval=1)

//compute bollinger bands
source = close
basis = sma(source, length)
dev = mult * stdev(source, length)
upper = basis + dev
lower = basis - dev

//compute moving averages
ma50 = sma(close,50)
ma100 = sma(close,100)
ma150 = sma(close,150)
ma200 = sma(close,200)
//up_trend = ma50 > ma100 and ma100 > ma150 and ma150 > ma200
//dn_trend = ma50 < ma100 and ma100 < ma150 and ma150 < ma200

//compute rsi
strength = rsi(close, rsi_period)

//plot indicators
//p1 = plot(upper, color=color.gray)
//p2 = plot(lower, color=color.gray)
//fill(p1, p2)
//p3 = plot(ma50, color=color.red)
//p4 = plot(ma100, color=color.blue)
//p5 = plot(ma150, color=color.green)
//p6 = plot(ma200, color=color.orange)

//units to buy
units = contribution / close

//long signal
if (close < lower and strength < 50)
    strategy.order("Long", strategy.long, units)

//close long signal
//if (close > upper and strength > 50 and strategy.position_size > 0)
    //strategy.order("Close Long", strategy.short, units)

//plot strategy equity
plot(strategy.openprofit, color=color.blue, linewidth=2, title="Open Profit")
Detail
https://www.fmz.com/strategy/440533
Last Modified
2024-01-31 14:20:11
