Name
动态移平均交叉组合策略Dynamic-Moving-Average-Crossover-Combo-Strategy
Author
ChaoZhang
Strategy Description
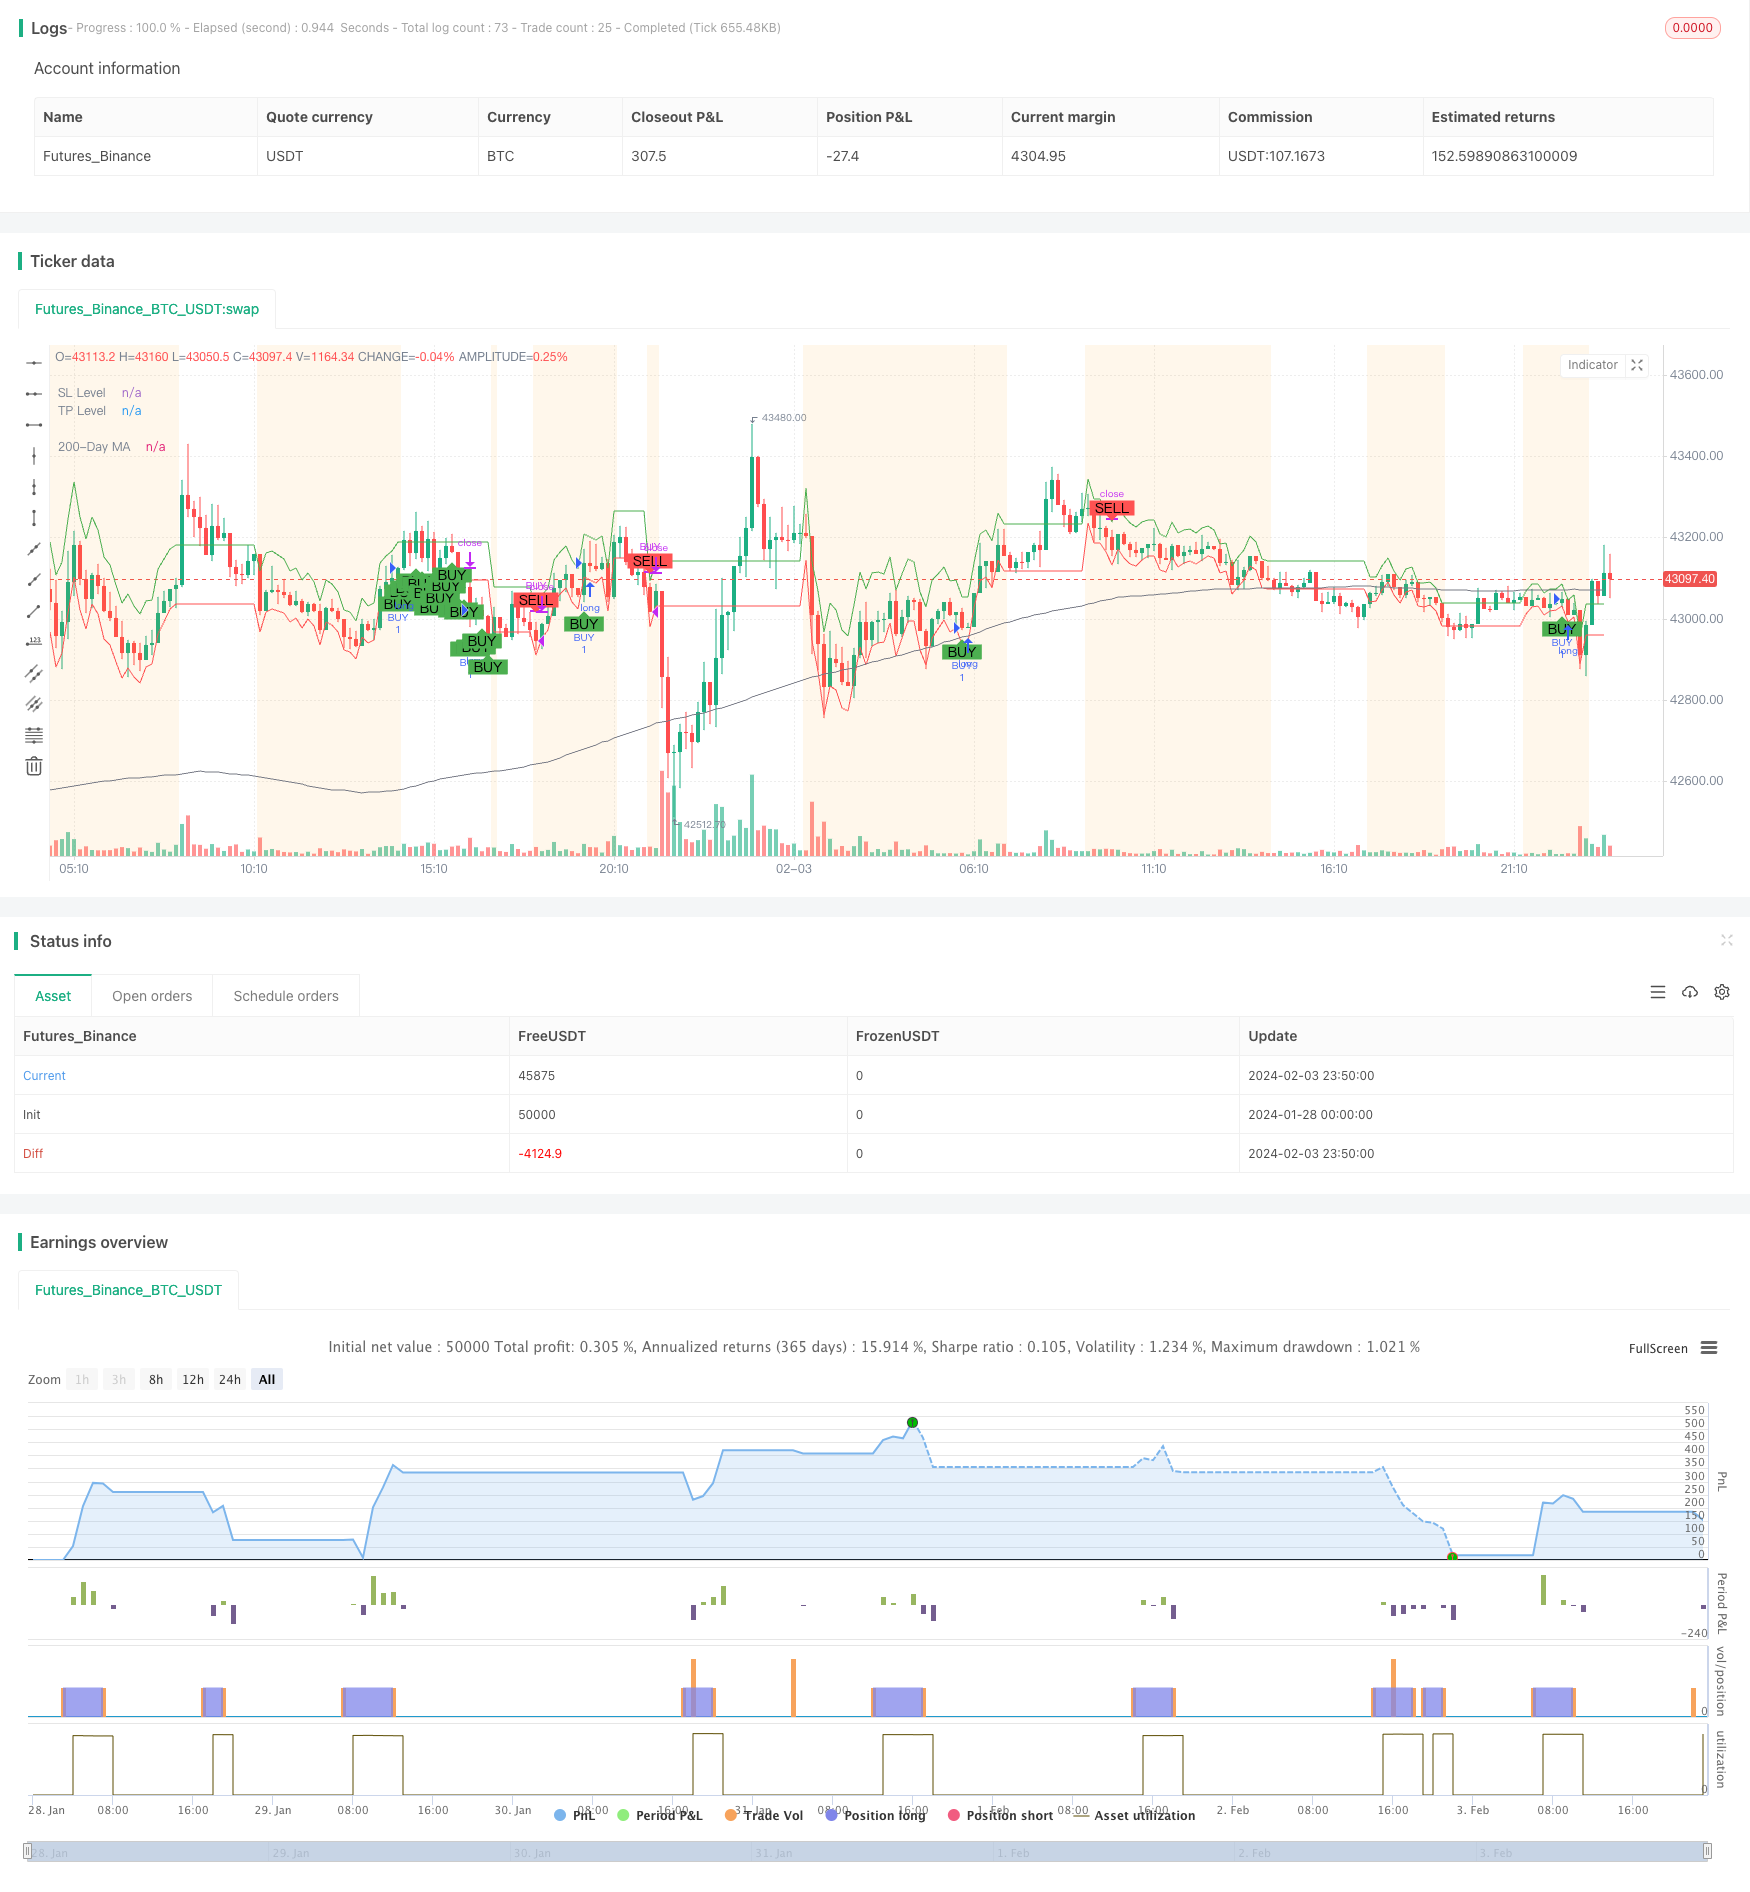
动态移平均交叉组合策略(Dynamic Moving Average Crossover Combo Strategy)是一个集成了多个技术指标和市场阶段检测的复合交易策略。它动态计算市场的波动性,根据价格与长期移动平均线的距离和波动性判断市场的三个阶段:震荡、趋势和整理。在不同市场阶段,策略采用不同的入市出场规则,同时结合EMA/SMA交叉、MACD和Bollinger Bands等多个指标发出买入和卖出信号。
使用ATR(平均真实波动幅度)指标计算最近14天的市场日内波动性。然后用100日简单移动平均线滤波,得到平均波动性。
计算价格相对200日简单移动平均线的距离。如果距离超过平均波动性的1.5倍,且方向明确,则判断为趋势行情。如果当前波动性超过平均波动性的1.5倍,则判断为震荡行情。
快速EMA周期为10天,慢速SMA周期为30天。当快速EMA上穿慢速SMA时,产生买入信号。
计算12、26、9参数MACD。当MACD柱变为正值时产生买入信号。
计算20日内的标准差Channel。如果Channel宽度小于自身的20日SMA,则判断为整理期。
震荡期:快慢线交叉或MACD柱变正,且收盘价在Bollinger Bands内,则入场做多。
趋势期:快慢线交叉或MACD柱变正则入场做多。
整理期:快慢线交叉,且收盘价高于Lower Band则入场做多。
满足以下条件则出场平仓:MACD连续两根K线为负,且收盘价连续两日下跌。
震荡期:另外当StockRSI进入超买区则出场。
整理期:另外当价格低于Upper Band则出场。
这是一个结合市场环境判断的智能交易策略,具有以下优势:
-
系统化操作,减少主观干预。
-
结合市场环境调整策略参数,更具适应性。
-
多指标组合,增加信号确定性。
-
Bollinger Bands自动止损,降低风险。
-
全方位条件判断,过滤假信号。
-
动态止损止盈,追踪趋势获利。
主要风险如下:
-
参数设置不当可能导致策略失效。建议优化参数组合。
-
突发事件造成模型失效。建议及时更新策略逻辑。
-
交易费用压缩获利空间。建议选择低手续费券商。
-
多指标组合提高策略复杂度。建议选择核心指标。
可以从以下几个维度继续优化:
-
优化市场环境判断标准,提高准确率。
-
增加机器学习模块,实现参数自适应。
-
结合文本处理判断重大事件风险。
-
多市场回测,寻找最佳组合参数。
-
增加止盈的 trailing stop 策略。
动态移平均交叉组合策略是一个多指标智能交易策略。它能够结合市场环境调整参数,实现条件判断式的系统化交易。具有较强的适应性和确定性。但参数设置和新增模块都需要谨慎,避免增加策略复杂性。整体而言,这是一个可行性较强的量化策略思路。
||
The Dynamic Moving Average Crossover Combo Strategy is a combined trading strategy that integrates multiple technical indicators and market condition detections. It dynamically calculates the market volatility and determines three market phases based on the price distance from the long term moving average and volatility: volatile, trending and consolidating. Under different market conditions, the strategy adopts different entry and exit rules and generates buy and sell signals with a combination of indicators like EMA/SMA crossover, MACD and Bollinger Bands.
Use ATR indicator to measure the market volatility of recent 14 days. Then apply a 100-day SMA filter to get the average volatility.
Calculate the distance between price and 200-day SMA. If the absolute distance exceeds 1.5 times of average volatility with a clear direction, it is determined as a trending market. If current volatility exceeds 1.5 times of average, it is a volatile market.
Fast EMA period is 10 days. Slow SMA period is 30 days. A buying signal is generated when fast EMA crosses above slow SMA.
Calculate MACD with 12, 26, 9 parameters. A positive MACD histogram gives buying signal.
Calculate 20-day standard deviation channel. If channel width is smaller than 20-day SMA of itself, it is consolidating.
Volatile: Enter long when crossover or MACD positive with price inside bands.
Trending: Enter long when crossover or MACD positive.
Consolidating: Enter long when crossover and price above lower band.
General: Exit when MACD negative for 2 bars and price drops 2 days.
Volatile: Plus exit when StockRSI overbought.
Consolidating: Plus exit when price below upper band.
The strategy has the following strengths:
-
Systematic operations with less subjective interventions.
-
Adaptive parameters adjusted based on market conditions.
-
Higher signal accuracy with multiple indicator combo.
-
Lower risk with Bollinger Bands auto stop loss.
-
All rounded condition filtering to avoid false signals.
-
Dynamic stop loss and take profit to follow trends.
The main risks are:
-
Invalid strategy if improper parameter tuning. Optimization suggested.
-
Model failure due to sudden events. Logic update recommended.
-
Compressed profit margin from trading cost. Low commission broker advised.
-
Higher complexity with multiple modules. Core indicators advised.
Potential directions of optimization:
-
Improve criteria for market environment judgment.
-
Introduce machine learning for automatic parameter adaption.
-
Add text analytics to detect events.
-
Multi-market backtesting to find best parameters.
-
Implement trailing stop strategy for better profit.
The Dynamic Moving Average Crossover Combo strategy is an intelligent multi-indicator quantitative trading system. It adjusts parameters dynamically based on market conditions to implement systematic rule-based trading. The strategy is highly adaptive and deterministic. But parameters and additional modules need to be introduced carefully to avoid over complexity. Overall this is a feasible quantitative strategy idea.
[/trans]
Source (PineScript)
/*backtest
start: 2024-01-28 00:00:00
end: 2024-02-04 00:00:00
period: 10m
basePeriod: 1m
exchanges: [{"eid":"Futures_Binance","currency":"BTC_USDT"}]
*/

//@version=5
strategy("Improved Custom Strategy", shorttitle="ICS", overlay=true)

// Volatility
volatility = ta.atr(14)
avg_volatility_sma = ta.sma(volatility, 100)
avg_volatility = na(avg_volatility_sma) ? 0 : avg_volatility_sma

// Market Phase detection
long_term_ma = ta.sma(close, 200)
distance_from_long_term_ma = close - long_term_ma
var bool isTrending = math.abs(distance_from_long_term_ma) > 1.5 * avg_volatility and not na(distance_from_long_term_ma)
var bool isVolatile = volatility > 1.5 * avg_volatility

// EMA/MA Crossover
fast_length = 10
slow_length = 30
fast_ma = ta.ema(close, fast_length)
slow_ma = ta.sma(close, slow_length)
crossover_signal = ta.crossover(fast_ma, slow_ma)

// MACD
[macdLine, signalLine, macdHistogram] = ta.macd(close, 12, 26, 9)
macd_signal = crossover_signal or (macdHistogram > 0)

// Bollinger Bands
source = close
basis = ta.sma(source, 20)
upper = basis + 2 * ta.stdev(source, 20)
lower = basis - 2 * ta.stdev(source, 20)
isConsolidating = (upper - lower) < ta.sma(upper - lower, 20)

// StockRSI
length = 14
K = 100 * (close - ta.lowest(close, length)) / (ta.highest(close, length) - ta.lowest(close, length))
D = ta.sma(K, 3)
overbought = 75
oversold = 25

var float potential_SL = na
var float potential_TP = na
var bool buy_condition = na
var bool sell_condition = na

// Buy and Sell Control Variables
var bool hasBought = false
var bool hasSold = true

// Previous values tracking
prev_macdHistogram = macdHistogram[1]
prev_close = close[1]

// Modify sell_condition with the new criteria
if isVolatile
    buy_condition := not hasBought and crossover_signal or macd_signal and (close > lower) and (close < upper)
    sell_condition := hasBought and (macdHistogram < 0 and prev_macdHistogram < 0) and (close < prev_close and prev_close < close[2])
    potential_SL := close - 0.5 * volatility
    potential_TP := close + volatility

if isTrending
    buy_condition := not hasBought and crossover_signal or macd_signal
    sell_condition := hasBought and (macdHistogram < 0 and prev_macdHistogram < 0) and (close < prev_close and prev_close < close[2])
    potential_SL := close - volatility
    potential_TP := close + 2 * volatility

if isConsolidating
    buy_condition := not hasBought and crossover_signal and (close > lower)
    sell_condition := hasBought and (close < upper) and (macdHistogram < 0 and prev_macdHistogram < 0) and (close < prev_close and prev_close < close[2])
    potential_SL := close - 0.5 * volatility
    potential_TP := close + volatility

// Update the hasBought and hasSold flags
if buy_condition
    hasBought := true
    hasSold := false

if sell_condition
    hasBought := false
    hasSold := true

// Strategy Entry and Exit
if buy_condition
    strategy.entry("BUY", strategy.long, stop=potential_SL, limit=potential_TP)
    strategy.exit("SELL_TS", from_entry="BUY", trail_price=close, trail_offset=close * 0.05)

if sell_condition
    strategy.close("BUY")

// Visualization
plotshape(series=buy_condition, style=shape.labelup, location=location.belowbar, color=color.green, text="BUY", size=size.small)
plotshape(series=sell_condition, style=shape.labeldown, location=location.abovebar, color=color.red, text="SELL", size=size.small)

plot(long_term_ma, color=color.gray, title="200-Day MA", linewidth=1)
plot(potential_SL, title="SL Level", color=color.red, linewidth=1, style=plot.style_linebr)
plot(potential_TP, title="TP Level", color=color.green, linewidth=1, style=plot.style_linebr)

bgcolor(isVolatile ? color.new(color.purple, 90) : isTrending ? color.new(color.blue, 90) : isConsolidating ? color.new(color.orange, 90) : na)
Detail
https://www.fmz.com/strategy/441045
Last Modified
2024-02-05 10:23:10
