Name
动态移动EMAS组合量化策略Dynamic-Moving-EMAs-Combination-Quant-Strategy
Author
ChaoZhang
Strategy Description
该策略是一种多时间周期的动态移动均线组合策略。它使用不同长度的指数移动平均线(EMA)进行趋势判断和入场退出。策略名称中的“MAX”表示使用了多个EMA,“动态”表示EMA长度是可以调整的。
该策略使用7条不同速度的EMA,从最快到最慢分别是:3周期、15周期、19周期、50周期、100周期、150周期和200周期的EMA。这7条EMA形成一个梯形排列,判断长仓和短仓信号时,close价格要依次突破这7条EMA,这样可以确保趋势转折后的强势进入。
此外,策略还结合了价格创新高和收盘价突破历史高点这两个条件来确认长仓信号,使用创新低和收盘价突破历史低点来确认短仓信号,这样可以避免假突破。
平仓条件则要求close价格依次从快速EMA向慢速EMA突破,表示趋势反转;或者最新K线的最低价或最高价突破4条EMA,表明该交易应立即平仓。
- 使用7条不同速度EMA形成梯形,可以更精准判断趋势转折点
- 结合创新高和历史高点判断长仓,创新低和历史低点判断短仓,避免假突破
- 双重平仓条件设定比较严格,可以及时止损
- 没有设置止损,存在巨大亏损风险
- 双重平仓条件可能造成过早离场现象
- 短周期EMA容易形成更多噪音,增加交易频率和手续费成本
解决方法:
- 设置立竿止损和移动止损
- 调整平仓EMA的长度,降低双重平仓条件的严格性
- 增加EMA长度,减少交易频率
- 增加止损策略,如固定百分比止损、移动止损等
- 调整EMA参数,寻找最佳参数组合
- 增加其他指标过滤,如MACD、ATR、KDJ等,提高信号质量
- 结合波段策略,在趋势中捕捉次级别波动
- 考虑加入资金管理模块
该策略整体思路清晰,使用7条不同速度EMA判断趋势,并设有双重平仓条件,可以对趋势反转做出较敏感的判断。但策略本身没有设置止损,存在极大的亏损风险,此外容易造成过早离场的问题。未来需要从止损、参数优化、指标过滤等多个维度进行策略的改进,使之成为一个稳定可靠的量化交易系统。
||
This strategy is a dynamic moving average combination strategy that works on multiple timeframes. It usesExponential Moving Averages (EMAs) of different lengths for trend judgment and entry/exit signals. The “MAX” in the strategy name stands for multiple EMAs, and “Dynamic” means the EMA lengths are adjustable.
The strategy employs 7 EMAs moving at different speeds, from the fastest to the slowest: 3-period EMA, 15-period EMA, 19-period EMA, 50-period EMA, 100-period EMA, 150-period EMA and 200-period EMA. These 7 EMAs are arranged in a trapezoidal formation. To generate long and short signals, the close price needs to break through these EMAs successively to ensure a strong post-reversal trend entry.
In addition, the strategy also incorporates price breaking recent high and close price crossing historical highs to confirm long signals, and uses breaking recent low and close price crossing historical lows to confirm short signals. This helps avoid false breakouts.
The exit rules require the close price to break the faster EMAs successively towards the slower EMAs, indicating a trend reversal. Alternatively, if the latest bar's low/high breaks more than 4 EMAs, it is also an exit signal for that position.
- Using 7 EMAs of different speeds forming a trapezoid shape can identify trend reversal points more precisely
- Incorporating new high/low and historical highs/lows avoids false breakout signals
- The strict dual exit rules allow timely stop loss
- No stop loss mechanism leads to huge loss potential
- The dual exit rules may cause premature exit
- Too many faster EMAs generate more noise and increase trading frequency and commission cost
Solutions:
- Add fixed percentage stop loss and trailing stop loss
- Adjust exit EMA lengths to lower the strictness of dual exit rules
- Increase EMA lengths to reduce trading frequency
- Add stop loss mechanisms like fixed percentage stop loss, trailing stop loss etc
- Optimize EMA parameters to find the best combination
- Add other indicators like MACD, ATR, KDJ etc to filter signals
- Combine with range/channel strategies to catch secondary moves in trends
- Consider adding position sizing rules
The strategy has a clear logic of using 7 EMAs of different speeds to determine trends and dual exit rules to detect reversals. But there is no stop loss mechanism leading to huge loss risk, and it may exit prematurely. Improvements can be made in aspects like adding stop loss, parameter tuning, indicator filtering to turn it into a solid trading system.
[/trans]
Strategy Arguments
| Argument | Default | Description |
|---|---|---|
| v_input_1 | 3 | Length |
| v_input_2 | 15 | Length2 |
| v_input_3 | 19 | Length3 |
| v_input_4 | 50 | Length4 |
| v_input_5 | 100 | Length44 |
| v_input_6 | 150 | Length5 |
| v_input_7 | 171 | Length6 |
| v_input_8 | 172 | Length66 |
| v_input_9_close | 0 | xPrice: close |
| v_input_10 | true | From Day |
| v_input_11 | true | From Month |
| v_input_12 | 2000 | From Year |
| v_input_13 | 31 | To Day |
| v_input_14 | 12 | To Month |
| v_input_15 | 2020 | To Year |
Source (PineScript)
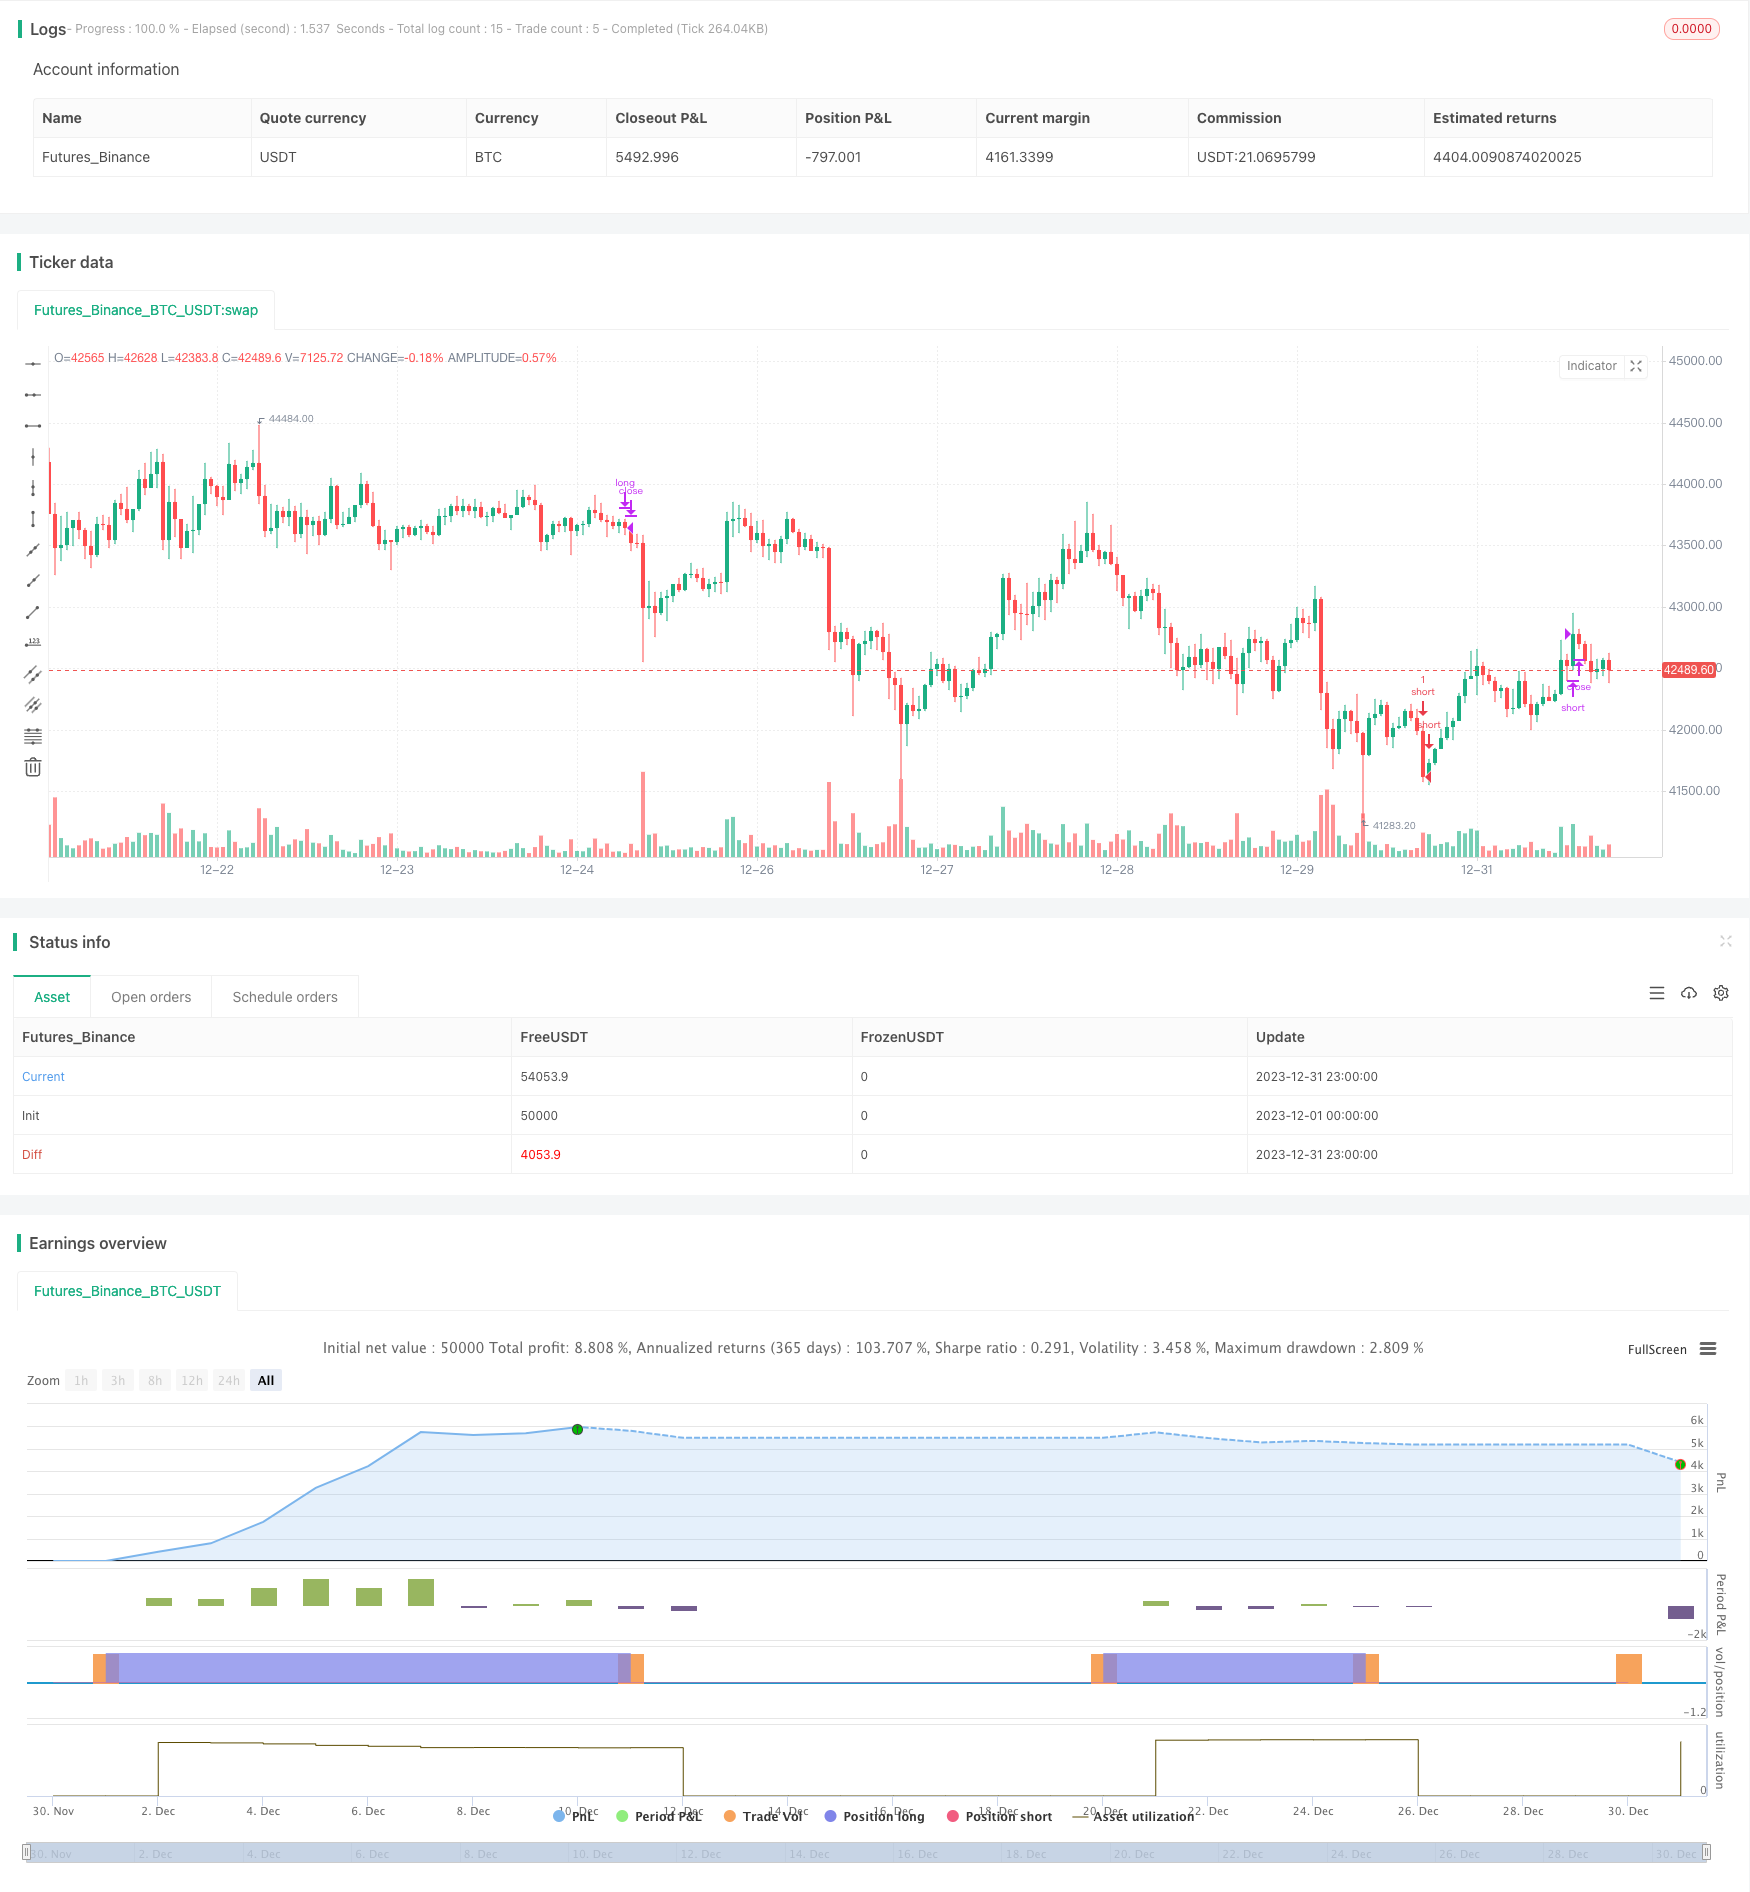
/*backtest
start: 2023-12-01 00:00:00
end: 2023-12-31 23:59:59
period: 1h
basePeriod: 15m
exchanges: [{"eid":"Futures_Binance","currency":"BTC_USDT"}]
*/

//@version=4
strategy(title="Crypto MAX Trend", shorttitle="Crypto MAX", overlay = true  )
Length = input(3, minval=1)
Length2 = input(15, minval=1)
Length3 = input(19, minval=1)
//Length33 = input(25, minval=1)
Length4 = input(50, minval=1)
Length44 = input(100, minval=1)
Length5 = input(150, minval=1)
Length6 = input(171, minval=1)
Length66 = input(172, minval=1)

xPrice = input(close)

xEMA1 = ema(xPrice, Length)
xEMA2 = ema(xPrice, Length2)
xEMA3 = ema(xPrice, Length3)
//xEMA33 = ema(xPrice, Length33)
xEMA4 = ema(xPrice, Length4)
xEMA44 = ema(xPrice, Length44)
xEMA5 = ema(xPrice, Length5)
xEMA6 = ema(xPrice, Length6)
xEMA66 = ema(xPrice, Length66)

// plot(xEMA1, color=color.white)
// plot(xEMA2, color=color.red)
// plot(xEMA3, color=color.green)
// plot(xEMA4, color=color.purple)
// plot(xEMA44, color=color.gray)
// plot(xEMA5, color=color.maroon)
// plot(xEMA6, color=color.blue)
// plot(xEMA66, color=color.orange)


fromDay = input(defval = 1, title = "From Day", minval = 1, maxval = 31)
fromMonth = input(defval = 1, title = "From Month", minval = 1, maxval = 12)
fromYear = input(defval = 2000, title = "From Year", minval = 1970)
 //monday and session
// To Date Inputs
toDay = input(defval = 31, title = "To Day", minval = 1, maxval = 31)
toMonth = input(defval = 12, title = "To Month", minval = 1, maxval = 12)
toYear = input(defval = 2020, title = "To Year", minval = 1970)

startDate = timestamp(fromYear, fromMonth, fromDay, 00, 00)
finishDate = timestamp(toYear, toMonth, toDay, 00, 00)
time_cond = true


long = close >  xEMA1 and xEMA1 > xEMA2 and xEMA2 > xEMA3  and xEMA3 > xEMA4  and xEMA4 > xEMA44 and xEMA44 > xEMA5 and xEMA5> xEMA6  and xEMA6> xEMA66  and close > high[1] and high[1] > high[2] and close > high[3] and close > high[4] and close > high[5] and high[5] > high[6] and time_cond
short = close < xEMA1 and xEMA1 < xEMA2 and xEMA2 < xEMA3  and xEMA3 < xEMA4  and xEMA4 < xEMA44 and xEMA44 < xEMA5 and xEMA5< xEMA6 and  xEMA6< xEMA66 and close < low[1] and low[1] < low[2] and close < low[3] and close < low[4] and close< low[5] and low[5] < low[6] and time_cond

notlong = close < xEMA1
strategy.entry("long",1,when=long)
strategy.entry("short",0,when=short)


exitlong1 = xEMA1 < xEMA2 and xEMA2 < xEMA3 and xEMA3 < xEMA4
exitlong2 = crossunder(low,xEMA1) and crossunder(low,xEMA2) and crossunder(low,xEMA3) and crossunder(low,xEMA4)
exitshort1 = xEMA1 > xEMA2 and xEMA2 > xEMA3 and xEMA3 > xEMA4
exitshort2 = crossover(high,xEMA1) and crossover(high,xEMA2) and crossover(high,xEMA3) and crossover(high,xEMA4)

strategy.close("long", when = exitlong1 or exitlong2)
strategy.close("short", when= exitshort1 or exitshort2)
Detail
https://www.fmz.com/strategy/439624
Last Modified
2024-01-22 12:34:33
