Name
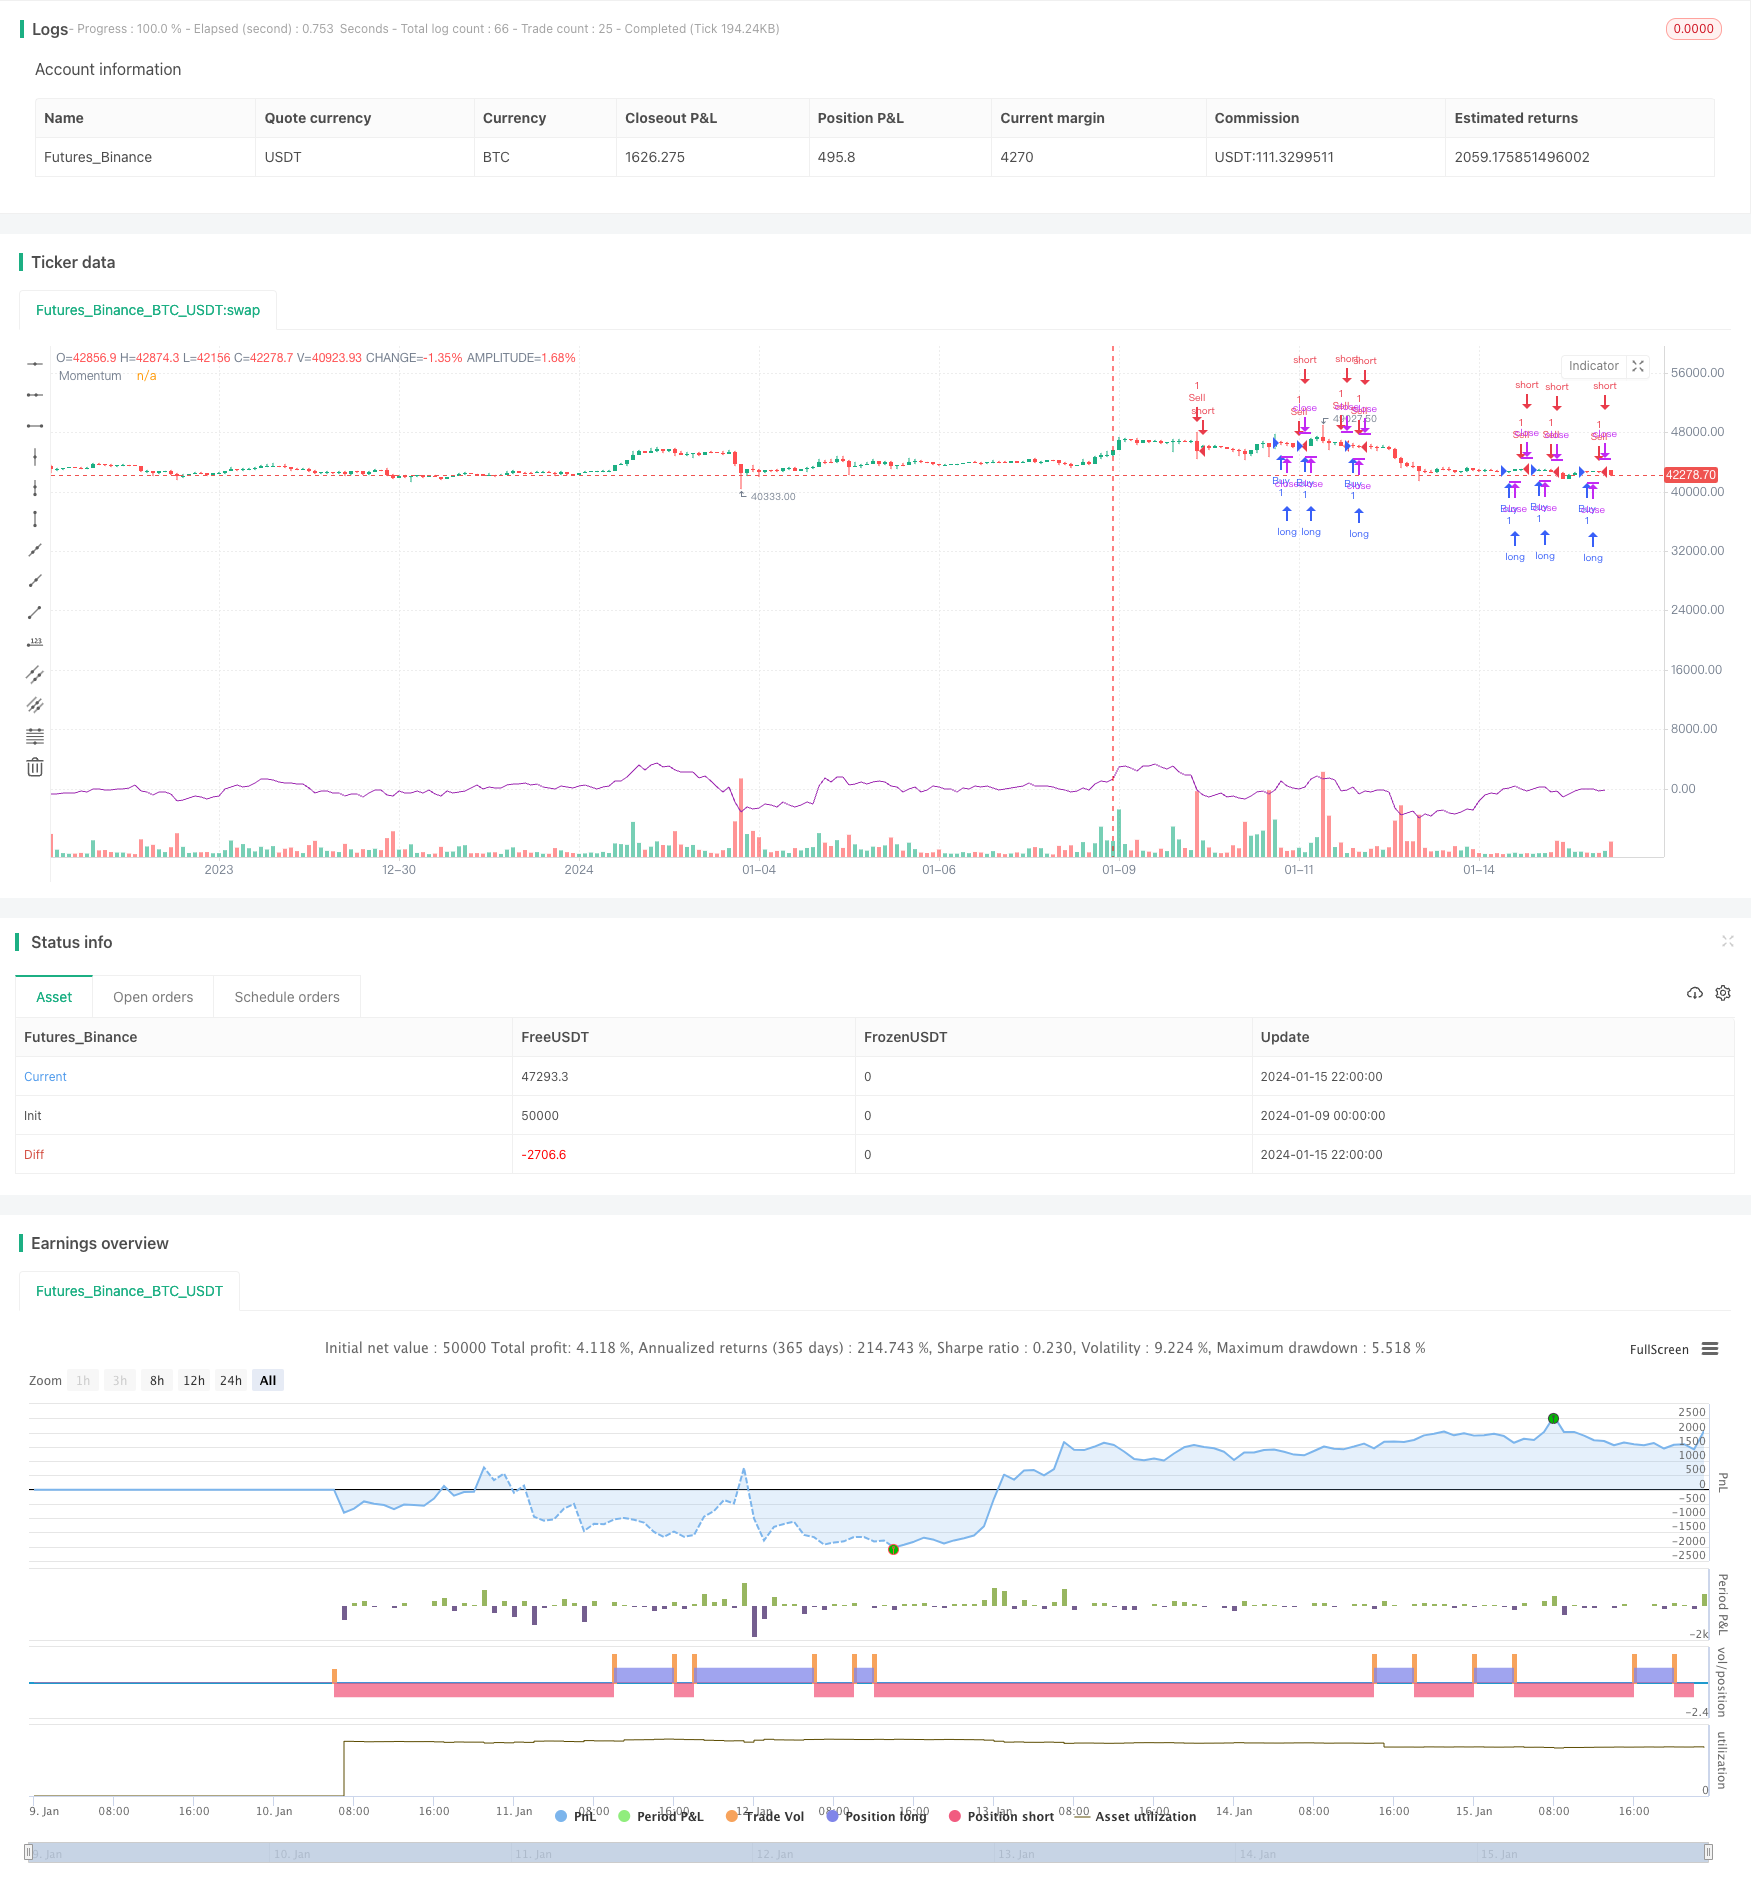
利用价格动量指标实现的趋势跟踪策略Momentum-Breakout-Strategy
Author
ChaoZhang
Strategy Description
该策略是一个利用价格动量指标实现的趋势跟踪策略。它通过计算一定周期内的收盘价变化来判断市场趋势,当价格出现持续的上涨或下跌趋势时,进行对应的做多或做空操作。
该策略的核心指标是价格的动量(momentum)。动量的计算公式为:
momentum = close - close[n]
其中n代表动量周期长度。当momentum > 0时,表示当前周期内价格一直在上涨;当momentum < 0时,表示当前周期内价格一直在下跌。
该策略首先设置一个confirmBars参数,代表需要几根K线的趋势判断才执行交易。在回测范围内,如果momentum > 0持续confirmBars根K线,则进行做多进入;如果momentum < 0持续confirmBars根K线,则进行做空进入。
该策略判断趋势的关键在于对momentum连续大于或小于0的K线数量进行统计,通过bcount和scount变量完成。它们在对应条件满足时+1,不满足时归0。当计数达到confirmBars时,执行对应做多或做空交易。
这是一个较简单的趋势跟踪策略,具有以下优势:
- 逻辑简单,容易理解实现
- 动量指标对价格变化敏感,可以快速捕捉趋势
- 可配置参数调整判断灵敏度
- 可在多种市场环境中使用
该策略也存在一些风险:
- 容易产生多次震荡交易和过度交易
- 需要合理配置参数,特别是confirmBars过滤震荡
- 无法有效应对市场突发事件的冲击
- 回测与实盘会有差异,需要复核数据和补充参数优化
该策略可以从以下几个方面进行优化:
- 增加止损逻辑,控制单次交易风险
- 增加突破过滤,避免价格震荡造成的虚假信号
- 根据不同品种和市场环境调整confirmBars等参数
- 增加多因子判断,结合其他指标确认入场
- 利用机器学习方法自适应参数与过滤规则
总的来说,该动量突破策略是一个简单实用的趋势跟踪策略,适合作为量化交易的入门策略之一。在应用过程中需要注意控制交易频率,防止过度交易和交易成本过高的问题。同时,参数与过滤规则都需要根据实际品种与市场环境进行调整优化,才能发挥策略最大效果。
||
This strategy is a trend following strategy that utilizes the price momentum indicator. It judges the market trend by calculating the closing price change over a certain period and makes corresponding long or short entries when there is a persistent upward or downward price trend.
The core indicator of this strategy is price momentum. The momentum is calculated as:
momentum = close - close[n]
where n represents the length of the momentum period. When momentum > 0, it means that the price has been rising during the current period. When momentum < 0, it means the price has been falling over the current period.
The strategy first sets a confirmBars parameter, which represents the number of candlesticks needed for the trend judgment before executing trades. Within the backtest range, if momentum > 0 persists for confirmBars candlesticks, a long entry is made. If momentum < 0 persists for confirmBars candlesticks, a short entry is made.
The key to the strategy's trend judgment lies in counting the number of consecutive candlesticks where momentum is greater than or less than 0, which is accomplished through the bcount and scount variables. They are incremented by 1 when the corresponding condition is met and reset to 0 when the condition is not met. When the count reaches confirmBars, the corresponding long or short trade is executed.
This is a relatively simple trend following strategy with the following advantages:
- Simple logic that is easy to understand and implement
- The momentum indicator is sensitive to price changes and can quickly capture trends
- Customizable parameters to adjust judgment sensitivity
- Can be used in various market environments
The strategy also has some risks:
- Prone to multiple oscillating trades and overtrading
- Reasonable parameter configuration is needed, especially confirmBars to filter oscillations
- Cannot effectively cope with the impact of sudden market events
- Differences between backtest and live trading, data and parameter optimization needed
The strategy can be optimized in several aspects:
- Add stop loss logic to control per trade risk
- Add breakout filters to avoid false signals from price oscillations
- Adjust confirmBars etc. parameters based on different products and market environments
- Incorporate other indicators to confirm entries
- Use machine learning methods to adapt parameters and filters
In summary, this momentum breakout strategy is a simple and practical trend following strategy suitable as a introductory quant trading strategy. In application, attention is needed to control trade frequency and prevent overtrading. Meanwhile, parameters and filters need to be adjusted and optimized based on actual products and market environments for the strategy to achieve maximum performance.
[/trans]
Strategy Arguments
| Argument | Default | Description |
|---|---|---|
| v_input_1 | true | confirmBars |
| v_input_2 | 14 | Momentum Length |
| v_input_int_1 | 2019 | Backtest Start Year |
| v_input_int_2 | true | Backtest Start Month |
| v_input_int_3 | true | Backtest Start Day |
| v_input_int_4 | 2023 | Backtest End Year |
| v_input_int_5 | 12 | Backtest End Month |
| v_input_int_6 | 31 | Backtest End Day |
Source (PineScript)
/*backtest
start: 2024-01-09 00:00:00
end: 2024-01-16 00:00:00
period: 2h
basePeriod: 15m
exchanges: [{"eid":"Futures_Binance","currency":"BTC_USDT"}]
*/

//@version=5
strategy("Momentum Strategy [TS Trader]", overlay=true)

confirmBars = input(1)
momentumLength = input(14, title="Momentum Length")

price = close
momentum = close - close[momentumLength]

// === INPUT BACKTEST RANGE ===
fromYear = input.int(2019, title="Backtest Start Year")
fromMonth = input.int(1, title="Backtest Start Month", minval=1, maxval=12)
fromDay = input.int(1, title="Backtest Start Day", minval=1, maxval=31)
toYear = input.int(2023, title="Backtest End Year")
toMonth = input.int(12, title="Backtest End Month", minval=1, maxval=12)
toDay = input.int(31, title="Backtest End Day", minval=1, maxval=31)

startTimestamp = timestamp(fromYear, fromMonth, fromDay, 00, 00)
endTimestamp = timestamp(toYear, toMonth, toDay, 23, 59)

inBacktestRange = true

// === STRATEGY LOGIC ===
bcond = momentum > 0
bcount = 0
bcount := bcond ? nz(bcount[1]) + 1 : 0
if (bcount == confirmBars and inBacktestRange)
    strategy.entry("Buy", strategy.long, comment="Long")

scond = momentum < 0
scount = 0
scount := scond ? nz(scount[1]) + 1 : 0
if (scount == confirmBars and inBacktestRange)
    strategy.entry("Sell", strategy.short, comment="Short")

// Plotting Momentum
plot(momentum, title="Momentum", color=color.purple)
Detail
https://www.fmz.com/strategy/439064
Last Modified
2024-01-17 13:58:19
