Name
低波动率买入高波动率买入策略Buy-Low-Volatility-VS-Buy-High-Volatility-Strategy
Author
ChaoZhang
Strategy Description
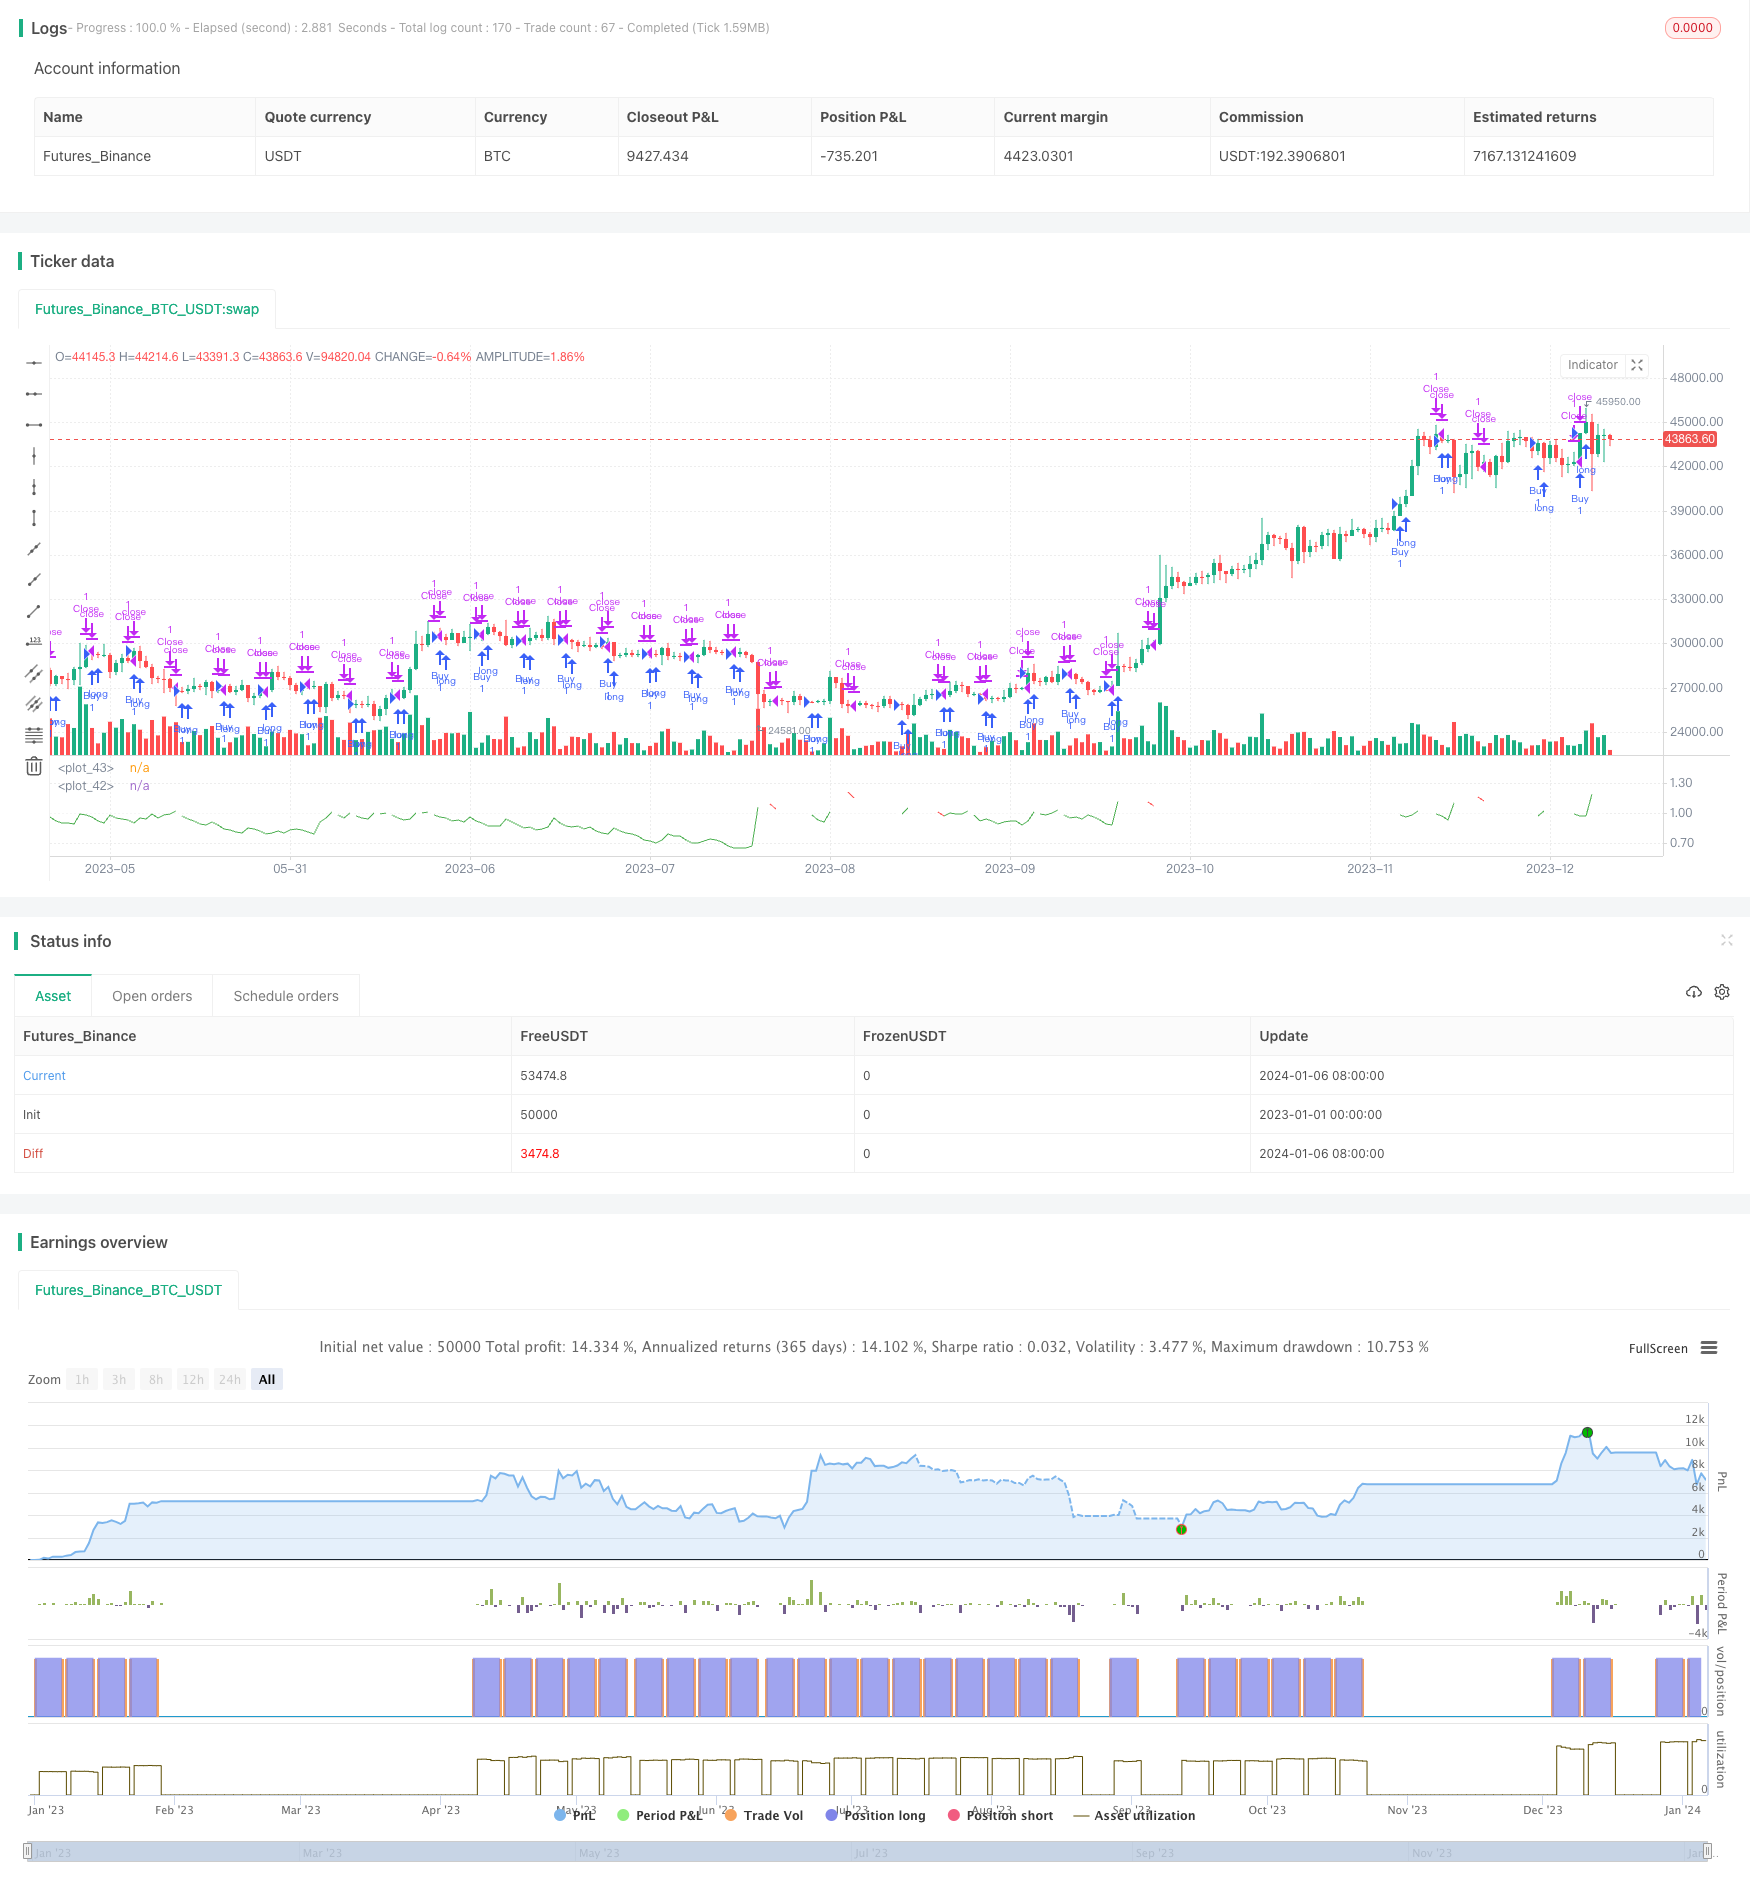
本策略目的是研究购买低波动率和高波动率期间的资产之间的差异。它允许用户通过改变mode输入变量在低波动率和高波动率期间选择买入。
本策略通过计算ATR和它的SMA来确定波动率。具体来说,它计算ATR的SMA,然后计算ATR与其SMA的比率。如果此比率高于用户定义的阈值volatilityTargetRatio,则认为波动率高;如果低于该阈值,则认为波动率低。
根据用户选择的mode,策略在波动率高或波动率低时产生买入信号。一旦买入,策略会持有一定的bars数目(由sellAfterNBarsLength定义),然后平仓。
该策略的主要优势如下:
- 可以直观地比较低波动率和高波动率期间的买入策略表现。
- 使用SMA平滑ATR,可以过滤假突破。
- 可以通过调整参数测试不同的波动率水平。
该策略的主要风险如下:
- 如果只买入低波动率,可能会错过价格上涨机会。
- 如果只买入高波动率,可能增加系统风险。
- 参数设置不当可能导致错过买入时机或平仓过早。
以上风险可以通过调整参数、组合不同波动率水平的买入来缓解。
该策略可以进一步优化:
- 测试不同的ATR长度参数。
- 增加止损策略。
- 结合其他指标过滤假突破。
- 优化买入和平仓条件。
本策略可以有效地比较低波动率和高波动率买入策略的表现。它使用SMA平滑ATR,根据波动率水平产生交易信号。该策略可以通过调整参数和优化条件得到改进。总的来说,本策略为研究波动率策略提供了有效工具。
||
This strategy aims to study the difference between buying assets when volatility is low and when it is high. It allows the user to choose whether to buy during low or high volatility periods by changing the mode input variable.
This strategy determines volatility by calculating the ATR and its SMA. Specifically, it calculates the SMA of ATR, and then computes the ratio between the ATR and its SMA. If this ratio is higher than the user-defined threshold volatilityTargetRatio, the volatility is considered high. If lower than the threshold, the volatility is considered low.
Depending on the mode chosen by the user, the strategy generates buy signals when volatility is high or low. Once bought, the strategy will hold for a number of bars defined by sellAfterNBarsLength, and then close the position.
The main advantages of this strategy are:
- Can intuitively compare the performance of buying strategies during low and high volatility periods.
- Using SMA to smooth ATR can filter false breakouts.
- Can test different volatility levels by tuning parameters.
The main risks of this strategy are:
- May miss price uptrend opportunities if only buying low volatility.
- May increase system risk if only buying high volatility.
- Inappropriate parameter settings may lead to missing buy opportunities or closing positions too early.
The above risks can be mitigated by adjusting parameters and combining buys from different volatility levels.
This strategy can be further optimized by:
- Testing different ATR length parameters.
- Adding stop loss strategies.
- Combining other indicators to filter false breakouts.
- Optimizing entry and exit criteria.
This strategy can effectively compare the performance of low volatility buy and high volatility buy strategies. It uses SMA to smooth ATR and generates trading signals based on volatility levels. The strategy can be improved through parameter tuning and optimizing conditions. Overall, this strategy provides an effective tool for researching volatility-based strategies.
[/trans]
Strategy Arguments
| Argument | Default | Description |
|---|---|---|
| v_input_string_1 | 0 | mode: Buy low Volatility |
| v_input_float_1 | true | volatilityTargetRatio |
| v_input_int_1 | 14 | atrLength |
| v_input_int_2 | 5 | sellAfterNBarsLength |
Source (PineScript)
/*backtest
start: 2023-01-01 00:00:00
end: 2024-01-07 00:00:00
period: 1d
basePeriod: 1h
exchanges: [{"eid":"Futures_Binance","currency":"BTC_USDT"}]
*/

// This source code is subject to the terms of the Mozilla Public License 2.0 at https://mozilla.org/MPL/2.0/
// © I11L

//@version=5
strategy("I11L - Better Buy Low Volatility or High Volatility?", overlay=false)

mode = input.string("Buy low Volatility",options = ["Buy low Volatility","Buy high Volatility"])
volatilityTargetRatio = input.float(1,minval = 0, maxval = 100,step=0.1, tooltip="1 equals the average atr for the security, a lower value means that the volatility is lower")
atrLength = input.int(14)

atr = ta.atr(atrLength) / close
avg_atr = ta.sma(atr,atrLength*5)
ratio = atr / avg_atr

sellAfterNBarsLength = input.int(5, step=5, minval=0)


var holdingBarsCounter = 0

if(strategy.opentrades > 0)
    holdingBarsCounter := holdingBarsCounter + 1


isBuy = false

if(mode == "Buy low Volatility")
    isBuy := ratio < volatilityTargetRatio
else
    isBuy := ratio > volatilityTargetRatio

isClose = holdingBarsCounter > sellAfterNBarsLength


if(isBuy)
    strategy.entry("Buy",strategy.long)

if(isClose)
    holdingBarsCounter := 0
    strategy.exit("Close",limit=close)

plot(ratio, color=isBuy[1] ? color.green : isClose[1] ? color.red : color.white)
plot(1, color=color.white)
Detail
https://www.fmz.com/strategy/438022
Last Modified
2024-01-08 11:33:58
