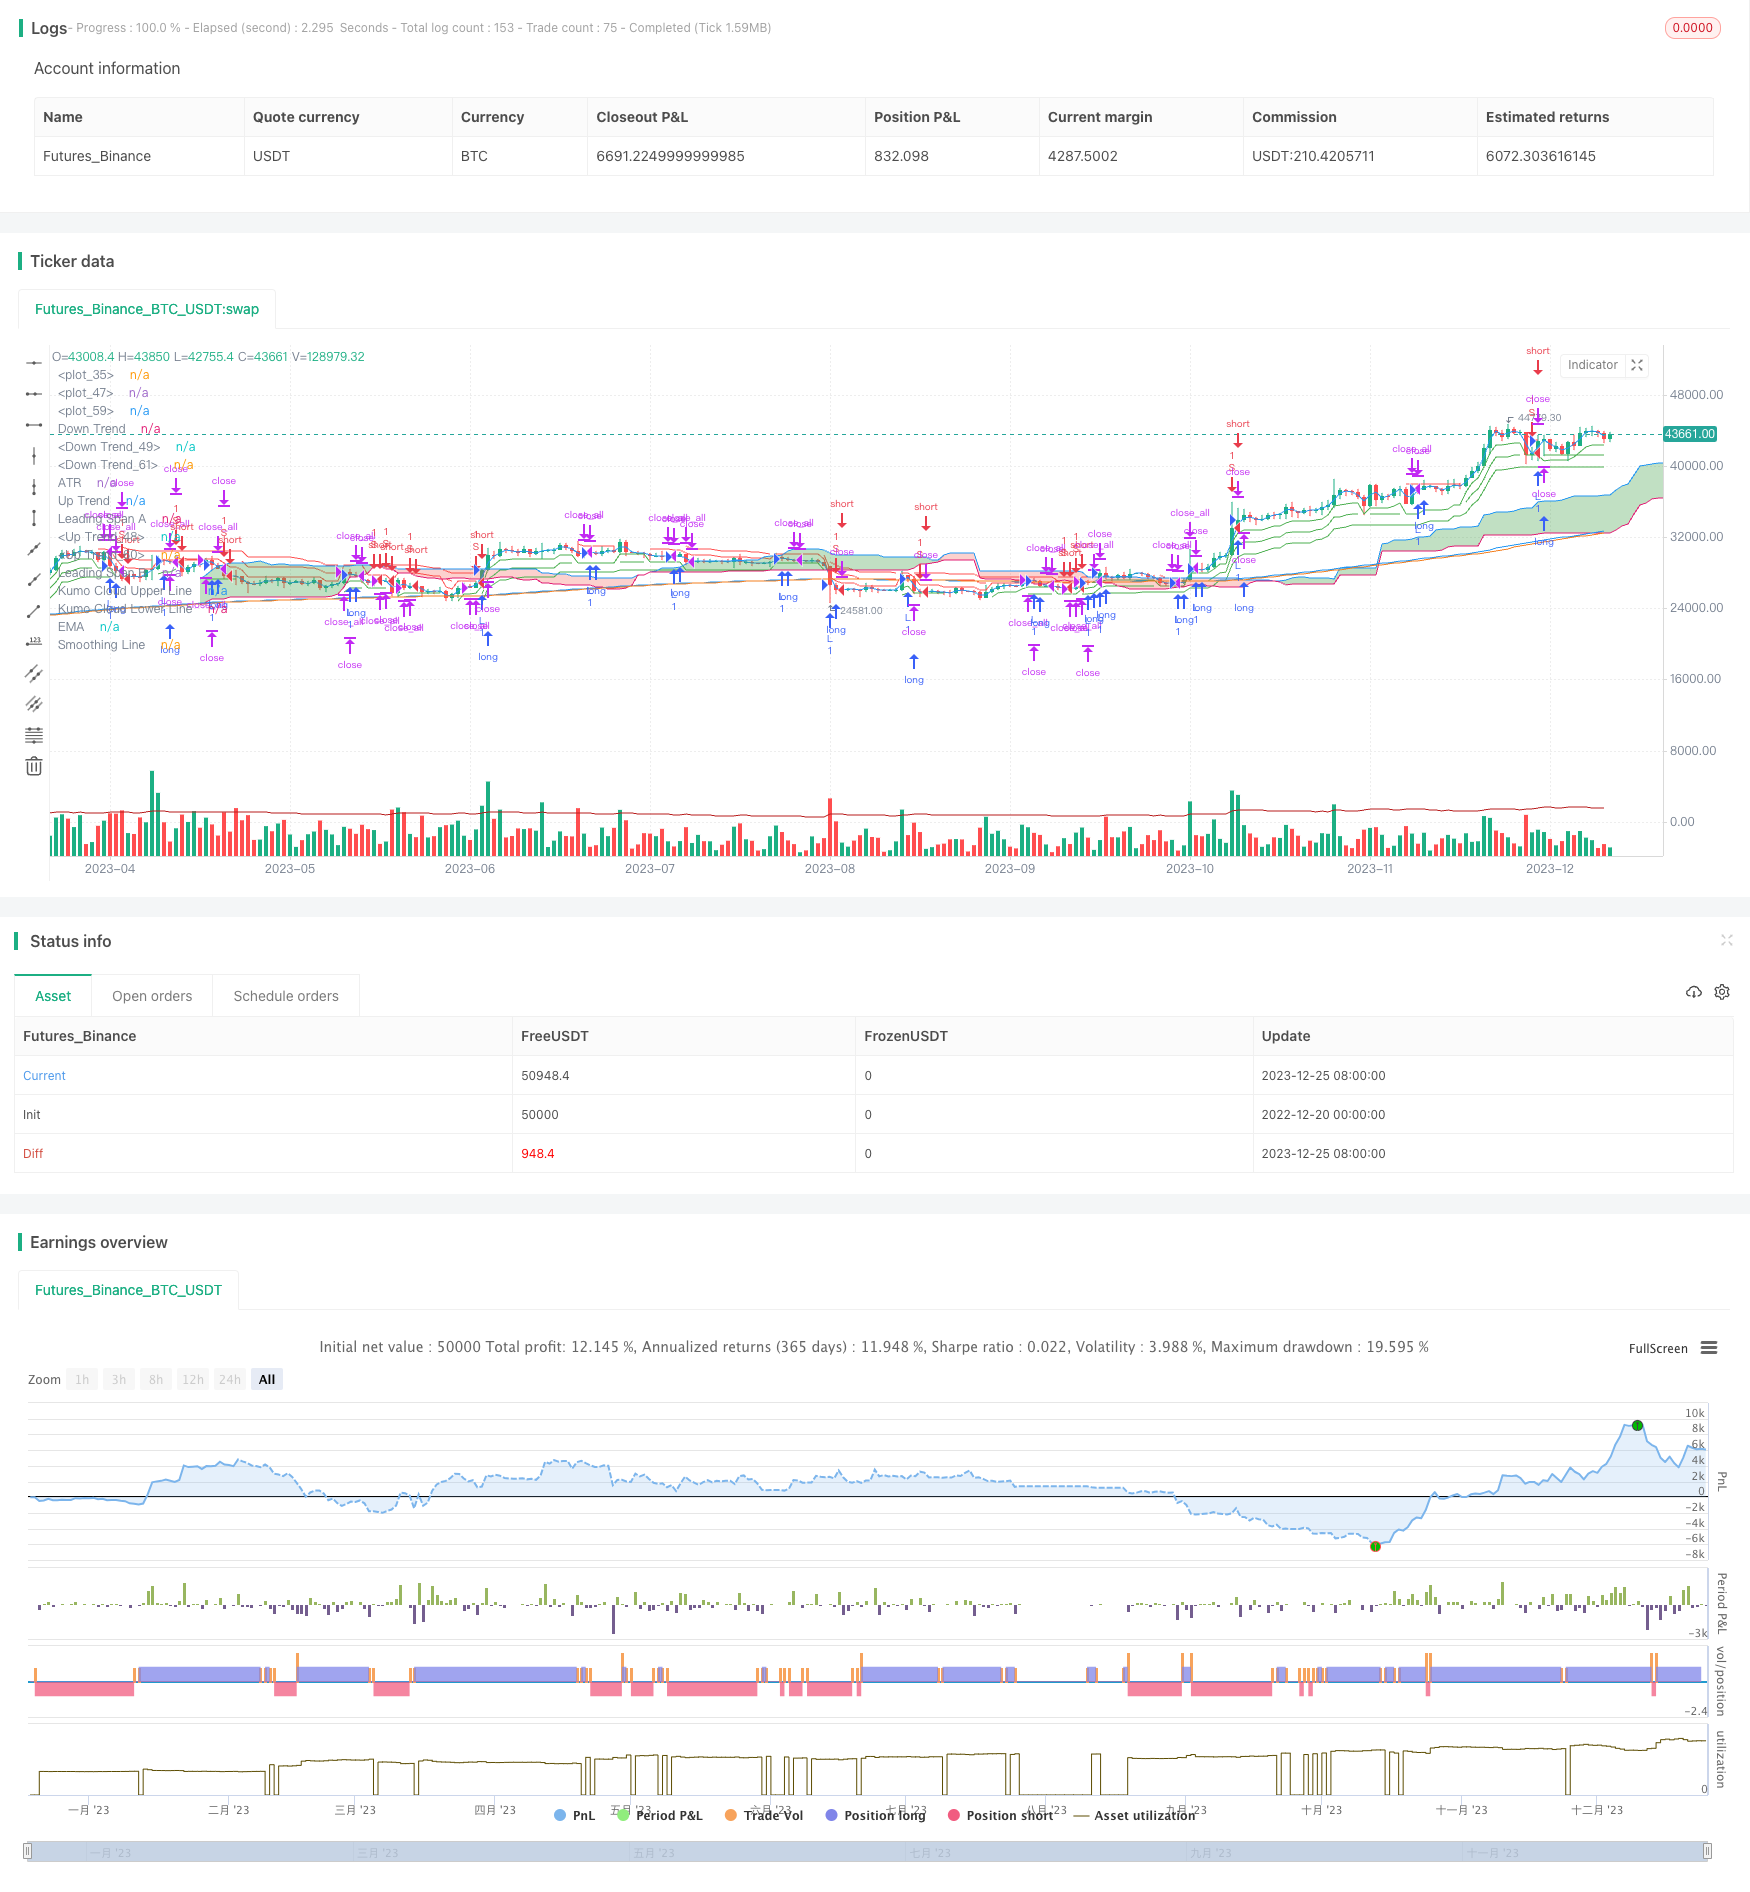
Name
三重超趋势Ichimoku云量化交易策略Triple-Supertrend-Ichimoku-Cloud-Quantitative-Trading-Strategy
Author
ChaoZhang
Strategy Description
本策略是一个结合三重超趋势指标、Ichimoku云指标、平均真实波幅(ATR)指标、指数移动平均线(EMA)的量化交易策略。该策略通过三重超趋势判断市场趋势方向,Ichimoku云判断支撑压力,ATR指标设置止损,EMA指标进行趋势确认,组成一个较为完整的交易系统。
本策略的核心逻辑基于三重超趋势指标的判断。超趋势指标通过比较价格与特定周期内的平均真实波幅的大小关系来判断趋势的方向。当价格高于上轨时为看涨信号,当价格低于下轨时为看跌信号。本策略采用三组不同参数的超趋势指标,当三组超趋势指标同时给出看涨或看跌信号时,发出交易信号。
另外,Ichimoku云指标给出的云厚度判断当前趋势的强弱,从而滤除一些假信号。ATR指标用于设置止损点。EMA指标用于确认中长线趋势。
具体来说,当价格高于三组超趋势指标的上轨时,做多;当价格低于三组超趋势指标的下轨时,做空。同时要求价格高于或低于Ichimoku云,过滤掉不确定的信号。止损点设置为开仓价格减去ATR指标的值,实现动态跟踪。
-
三重超趋势指标参数设置不同,能够有效过滤市场上的噪音,判断趋势方向的准确性较高。
-
Ichimoku云指标判断趋势强弱,避免假突破。ATR止损设置合理,最大程度避免巨额亏损。
-
EMA指标辅助判断中长线趋势方向,与超趋势判断互相验证,进一步提高信号的可靠性。
-
结合多种指标,不同指标之间可以互相验证,综合判断市场趋势,信号较为可靠。
-
虽然加入Ichimoku云指标判断,也会存在突破云厚度进入无效区域的风险。这时ATR指标会将部分亏损控制在一定范围。
-
当行情剧烈波动时,ATR指标设置的止损点可能会被直接触发,从而增加策略的亏损率。这时可以适当调整ATR参数或增加止损范围。
-
如果三重超趋势指标参数设置不当,可能会产生许多无效信号。这需要通过大量回测寻找最佳组合参数。
-
可以进一步加入其他指标判断,例如波动率指标、布林带指标等,辅助过滤信号,提高可靠性。
-
可以通过改进ATR指标的计算方式,在大幅波动中动态调整止损范围,降低亏损率。
-
可以加入机器学习模型,通过对历史数据训练判断买卖信号,降低人工参数设置的影响,提高信号准确率。
本策略综合运用三重超趋势、Ichimoku云、ATR指标、EMA指标四个部分。通过不同指标互相验证信号,判断市场趋势方向。Ichimoku云和ATR止损控制风险,EMA辅助确认中长线趋势。该策略信号较为可靠,适合中长线持有。可进一步优化止损机制,并增加其他辅助指标判断,从而获得更好的策略效果。
||
This strategy is a quantitative trading strategy that combines triple supertrend indicator, Ichimoku cloud indicator, average true range (ATR) indicator and exponential moving average (EMA). It uses triple supertrend to determine market trend, Ichimoku cloud for support and resistance, ATR for stop loss, EMA for trend confirmation to form a relatively complete trading system.
The core logic of this strategy is based on the triple supertrend indicator. The supertrend indicator determines the trend direction by comparing the price with the average true range within a certain period. When the price is above the upper band, it is a bullish signal, and when the price is below the lower band, it is a bearish signal. This strategy adopts three supertrend indicators with different parameters. Trading signals are generated when all three give buy or sell signals at the same time.
In addition, the Ichimoku cloud thickness helps determine the strength of the current trend to filter out some false signals. The ATR indicator is used to set the stop loss. The EMA indicator confirms the intermediate and long term trends.
Specifically, go long when the price is above the upper band of all three supertrend indicators, and go short when below the lower band of all three. Also require the price to be above or below the Ichimoku cloud to filter uncertain signals. The stop loss is set to entry price minus the ATR value for a dynamic trailing stop.
-
The triple supertrend indicators with different settings can effectively filter market noise and determine trend direction more accurately.
-
Ichimoku cloud determines trend strength to avoid false breakouts. ATR stop loss setting is reasonable to avoid huge losses to the maximum extent.
-
EMA assists in confirming intermediate and long term trend direction, verifying signals from supertrend, further improving reliability.
-
Combining multiple indicators, the signals are more reliable as they can verify each other when determining market trend.
-
Although Ichimoku cloud is added, there is still risk of entering invalid zone if cloud thickness is penetrated. The ATR would cap losses to some extent.
-
When volatility is high, stop loss set by ATR could be triggered directly, thus increasing loss rate. Parameters can be adjusted or stop loss range increased.
-
Invalid signals may occur frequently if supertrend parameters are set inappropriately. A lot of backtests are needed to find optimum combination.
-
More indicators like volatility index, Bollinger Bands can be added to assist filtering signals and improve reliability.
-
Improve ATR calculation to dynamically adjust stop loss range during huge swings to lower loss rate.
-
Add machine learning model trained on historical data to judge trading signals instead of manual parameter setting. Signal accuracy can be improved.
This strategy combines four parts including triple supertrend, Ichimoku cloud, ATR and EMA. Signals are verified across indicators when determining market trend. Ichimoku cloud and ATR stop loss control risk. EMA confirms intermediate and long term trend. Signals from this strategy is relatively reliable for intermediate to long term holding. Stop loss can be further optimized and more assisting indicators can be added to obtain better strategy performance.
[/trans]
Strategy Arguments
| Argument | Default | Description |
|---|---|---|
| v_input_int_1 | 2 | percent of portfo per order |
| v_input_int_2 | 9 | (?ichimoku)Conversion Line Length |
| v_input_int_3 | 26 | Base Line Length |
| v_input_int_4 | 52 | Leading Span B Length |
| v_input_int_5 | 26 | Lagging Span |
| v_input_1 | 10 | (?SuperTrend)ATR Length1 |
| v_input_float_1 | true | Factor1 |
| v_input_2 | 11 | ATR Length2 |
| v_input_float_2 | 2 | Factor2 |
| v_input_3 | 12 | ATR Length2 |
| v_input_float_3 | 3 | Factor2 |
| v_input_int_6 | 14 | (?ATR)Length (ATR) |
| v_input_string_1 | 0 | Smoothing (ATR): RMA |
| v_input_int_7 | 200 | (?EMA)Length of EMA |
| v_input_4_close | 0 | Source of EMA: close |
| v_input_int_8 | false | Offset (EMA) |
| v_input_string_2 | 0 | Method (EMA): SMA |
| v_input_int_9 | 5 | Smoothing Length (EMA) |
Source (PineScript)
/*backtest
start: 2022-12-20 00:00:00
end: 2023-12-26 00:00:00
period: 1d
basePeriod: 1h
exchanges: [{"eid":"Futures_Binance","currency":"BTC_USDT"}]
*/

//@version=5
strategy(title="HyperTrend", shorttitle="HyperTrend", overlay=true )

//
float percent_of_portfo = input.int(2, title = "percent of portfo per order", minval = 0, maxval = 100) / 100

// ichimoku Cloud
conversionPeriods = input.int(9, minval=1, title="Conversion Line Length", group = "ichimoku")
basePeriods = input.int(26, minval=1, title="Base Line Length", group = "ichimoku")
laggingSpan2Periods = input.int(52, minval=1, title="Leading Span B Length", group = "ichimoku")
displacement = input.int(26, minval=1, title="Lagging Span", group = "ichimoku")
donchian(len) => math.avg(ta.lowest(len), ta.highest(len))
conversionLine = donchian(conversionPeriods)
baseLine = donchian(basePeriods)
leadLine1 = math.avg(conversionLine, baseLine)
leadLine2 = donchian(laggingSpan2Periods)
p1 = plot(leadLine1, offset = displacement - 1, color=#A5D6A7,
	 title="Leading Span A", display = display.none)
p2 = plot(leadLine2, offset = displacement - 1, color=#ef9a9a,
	 title="Leading Span B", display = display.none)
plot(leadLine1 > leadLine2 ? leadLine1 : leadLine2, offset = displacement - 1, title = "Kumo Cloud Upper Line", display = display.none)
plot(leadLine1 < leadLine2 ? leadLine1 : leadLine2, offset = displacement - 1, title = "Kumo Cloud Lower Line", display = display.none)
fill(p1, p2, color = leadLine1 > leadLine2 ? color.rgb(67, 160, 72, 59) : color.rgb(244, 67, 54, 70))


// three supertrend

//1
atrPeriod1 = input(10, "ATR Length1", group="SuperTrend")
factor1 = input.float(1.0, "Factor1", step = 0.01, group="SuperTrend")

[supertrend1, direction1] = ta.supertrend(factor1, atrPeriod1)
supertrend1 := barstate.isfirst ? na : supertrend1

bodyMiddle1 = plot(barstate.isfirst ? na : (open + close) / 2, display = display.none)
upTrend1 =    plot(direction1 < 0 ? supertrend1 : na, "Up Trend",   color = color.green, style = plot.style_linebr)
downTrend1 =  plot(direction1 < 0 ? na : supertrend1, "Down Trend", color = color.red,   style = plot.style_linebr)


//2
atrPeriod2 = input(11, "ATR Length2", group="SuperTrend")
factor2 = input.float(2.0, "Factor2", step = 0.01, group="SuperTrend")

[supertrend2, direction2] = ta.supertrend(factor2, atrPeriod2)
supertrend2 := barstate.isfirst ? na : supertrend2

bodyMiddle2 = plot(barstate.isfirst ? na : (open + close) / 2, display = display.none)
upTrend2 =    plot(direction2 < 0 ? supertrend2 : na, "Up Trend",   color = color.green, style = plot.style_linebr)
downTrend2 =  plot(direction2 < 0 ? na : supertrend2, "Down Trend", color = color.red,   style = plot.style_linebr)


//3
atrPeriod3 = input(12, "ATR Length2", group="SuperTrend")
factor3 = input.float(3.0, "Factor2", step = 0.01, group="SuperTrend")

[supertrend3, direction3] = ta.supertrend(factor3, atrPeriod3)
supertrend3 := barstate.isfirst ? na : supertrend3

bodyMiddle3 = plot(barstate.isfirst ? na : (open + close) / 2, display = display.none)
upTrend3 =    plot(direction3 < 0 ? supertrend3 : na, "Up Trend",   color = color.green, style = plot.style_linebr)
downTrend3 =  plot(direction3 < 0 ? na : supertrend3, "Down Trend", color = color.red,   style = plot.style_linebr)


// ATR
lengthATR = input.int(title="Length (ATR)", defval=14, minval=1, group="ATR")
smoothingATR = input.string(title="Smoothing (ATR)", defval="RMA", options=["RMA", "SMA", "EMA", "WMA"], group="ATR")
ma_function(sourceATR, lengthATR) =>
	switch smoothingATR
		"RMA" => ta.rma(sourceATR, lengthATR)
		"SMA" => ta.sma(sourceATR, lengthATR)
		"EMA" => ta.ema(sourceATR, lengthATR)
		=> ta.wma(sourceATR, lengthATR)
ATR = ma_function(ta.tr(true), lengthATR)
plot(ATR, title = "ATR", color=color.new(#B71C1C, 0), display = display.none)

// EMA
lenEMA = input.int(200, minval=1, title="Length of EMA", group="EMA")
srcEMA = input(close, title="Source of EMA", group="EMA")
offset = input.int(title="Offset (EMA)", defval=0, minval=-500, maxval=500, group="EMA")
outEMA = ta.ema(srcEMA, lenEMA)
plot(outEMA, title="EMA", color=color.blue, offset=offset, display = display.none)

ma(sourceEMA, lengthEMA, type) =>
    switch type
        "SMA" => ta.sma(sourceEMA, lengthEMA)
        "EMA" => ta.ema(sourceEMA, lengthEMA)
        "SMMA (RMA)" => ta.rma(sourceEMA, lengthEMA)
        "WMA" => ta.wma(sourceEMA, lengthEMA)
        "VWMA" => ta.vwma(sourceEMA, lengthEMA)

typeMA = input.string(title = "Method (EMA)", defval = "SMA", options=["SMA", "EMA", "SMMA (RMA)", "WMA", "VWMA"], group="EMA")
smoothingLengthEMA = input.int(title = "Smoothing Length (EMA)", defval = 5, minval = 1, maxval = 100, group="EMA")

smoothingLine = ma(outEMA, smoothingLengthEMA, typeMA)
plot(smoothingLine, title="Smoothing Line", color=#f37f20, offset=offset, display=display.none)


//logic


if (open + ATR > supertrend1) and (open + ATR > supertrend2) and (open + ATR > supertrend3)
	strategy.entry("L", strategy.long)
else if (open < supertrend1 + ATR) and (open < supertrend2 + ATR) and (open < supertrend3 + ATR)
	strategy.entry("S", strategy.short)
else
	strategy.close_all("C")
Detail
https://www.fmz.com/strategy/436763
Last Modified
2023-12-27 15:22:40