Name
三重移动平均线趋势跟踪策略Triple-Moving-Average-Trend-Following-Strategy
Author
ChaoZhang
Strategy Description
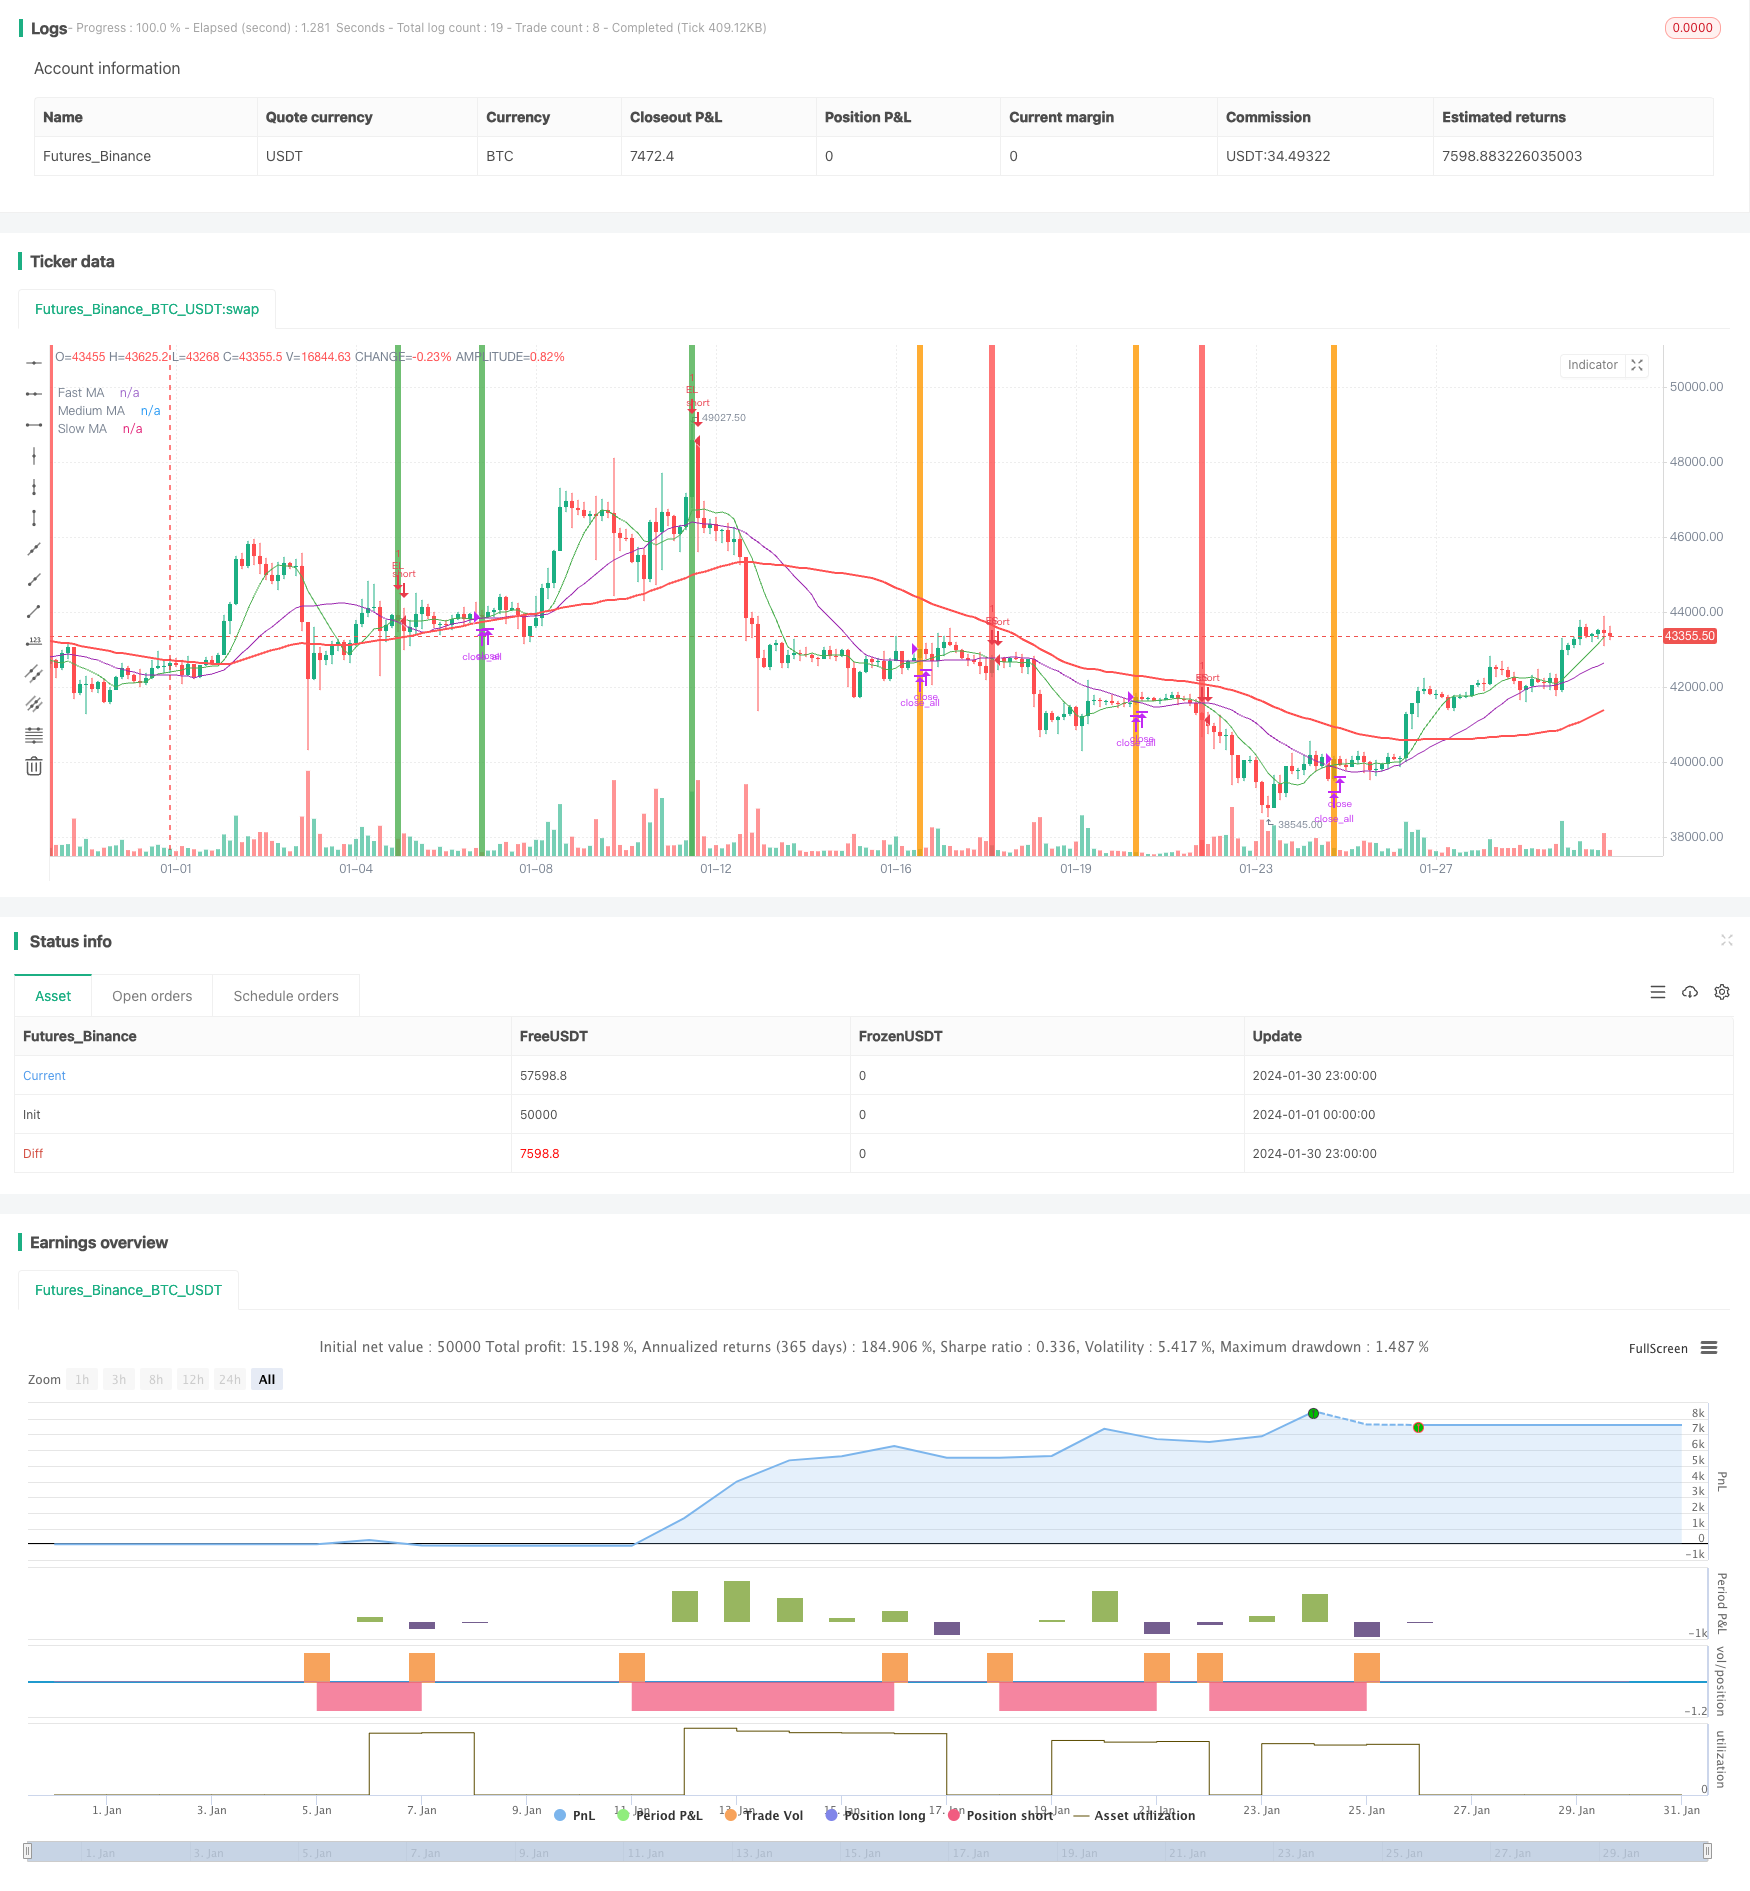
本策略结合了乌龟交易法的概念与Niko Bakkers的相位分析,使用三条不同周期的移动平均线来判断趋势方向,实现追踪趋势获利。当快速移动平均线上穿中速移动平均线并且三条移动平均线都处于同一上升或下降趋势时做多;当快速移动平均线下穿中速移动平均线并且三条移动平均线都处于同一上升或下降趋势时做空。
-
计算三条不同周期的移动平均线:快速移动平均线周期为8天,中速移动平均线周期为21天,慢速移动平均线周期为55天。
-
判断入场条件:当快速移动平均线上穿中速移动平均线,并且三条移动平均线都处于上升趋势时,做多;当快速移动平均线下穿中速移动平均线,并且三条移动平均线都处于下降趋势时,做空。
-
判断出场条件:快速移动平均线反向穿越中速移动平均线时平仓。
-
仓位控制:采用固定仓位,每次开仓1手。也可选择根据ATR动态调整仓位。
-
使用三条移动平均线有助于判断趋势方向,避免假突破。
-
追踪趋势运行,利润潜力大。
-
采用移动平均线则获利稳定,回撤相对较小。
-
可控的止损策略,降低大幅亏损的概率。
-
容易产生多次小额亏损,降低盈利效率。
-
移动平均线滞后,可能错过趋势反转点。
-
固定仓位无法有效控制风险,大幅行情震荡时可能爆仓。
-
参数优化不当则会过于频繁开仓平仓,增加交易费用和滑点损失。
-
优化移动平均线的周期参数,使其更符合交易品种的特点。
-
应用波动率指标ATR动态调整仓位。
-
加入止损策略。
-
结合交易量指标判断趋势可靠性。
本策略整合了传统技术分析指标与乌龟交易法的理念,使用三条移动平均线追踪趋势,在参数优化得当的情况下,可以获得较好的盈利效果。但本策略也存在一定的风险,需要加入止损和仓位管理等举措来控制风险,从而获得长期稳定盈利的量化交易策略。
||
This strategy combines the concept of turtle trading with Niko Bakkers' phase analysis, using three moving averages of different cycles to determine the trend direction for trend following. It goes long when the fast moving average crosses over the medium moving average and all three moving averages are in the same upward or downward trend; It goes short when the fast moving average crosses below the medium moving average and all three moving averages are in the same upward or downward trend.
-
Calculate three moving averages of different cycles: the fast moving average period is 8 days, the medium moving average period is 21 days, and the slow moving average period is 55 days.
-
Determine entry conditions: when the fast moving average crosses above the medium moving average, and all three moving averages are in an upward trend, go long; when the fast moving average crosses below the medium moving average, and all three moving averages are in a downward trend, go short.
-
Determine exit conditions: close positions when the fast moving average crosses the medium moving average in the opposite direction.
-
Position sizing: use fixed position sizing, open 1 contract each time. ATR can also be used to dynamically adjust position sizing.
-
Using three moving averages helps determine the trend direction and avoid false breakouts.
-
Trend following for profit potential.
-
Using moving averages results in stable profits and relatively small drawdowns.
-
Controllable stop loss strategy reduces probability of huge losses.
-
Prone to multiple small losses, lowering profit efficiency.
-
Moving averages lag and may miss trend reversal points.
-
Fixed position sizing cannot effectively control risks, may cause margin call during significant market fluctuation.
-
Improper parameter optimization leads to over-trading, increasing trading costs and slippage.
-
Optimize moving average periods to suit the characteristics of the trading instrument.
-
Use ATR to dynamically adjust position sizing.
-
Add stop loss strategy.
-
Incorporate trading volume indicators to determine reliability of trends.
This strategy integrates traditional technical indicators and the philosophy of turtle trading, using three moving averages to track trends. With proper parameter optimization, it can achieve good profitability. But it also has some risks. Stop loss, position sizing and other measures need to be utilized to control risks and obtain long-term steady profits from this quantitative trading strategy.
[/trans]
Strategy Arguments
| Argument | Default | Description |
|---|---|---|
| v_input_1 | 8 | Fast MA Length |
| v_input_2 | 21 | Medium MA Length |
| v_input_3 | 55 | Slow MA Length |
| v_input_4 | 12 | From Month |
| v_input_5 | true | From Day |
| v_input_6 | 2016 | From Year |
| v_input_7 | true | To Month |
| v_input_8 | true | To Day |
| v_input_9 | 9999 | To Year |
| v_input_10 | true | Use Position Sizing? |
| v_input_11 | 0.5 | Risk % |
Source (PineScript)
/*backtest
start: 2024-01-01 00:00:00
end: 2024-01-31 00:00:00
period: 3h
basePeriod: 15m
exchanges: [{"eid":"Futures_Binance","currency":"BTC_USDT"}]
*/

// LOVE JOY PEACE PATIENCE KINDNESS GOODNESS FAITHFULNESS GENTLENESS SELF-CONTROL
// This source code is subject to the terms of the Mozilla Public License 2.0 at https://mozilla.org/MPL/2.0/
// © JoshuaMcGowan

//@version=4

// 1. Define strategy settings
strategy(title="Triple Moving Average", overlay=true,
     pyramiding=0, initial_capital=1000,
     commission_type=strategy.commission.cash_per_order,
     commission_value=4, slippage=2)

fastMALen = input(title="Fast MA Length", type=input.integer, defval=8)
medMALen  = input(title="Medium MA Length", type=input.integer, defval=21)
slowMALen = input(title="Slow MA Length", type=input.integer, defval=55)

//endMonth = input(title="End Month Backtest", type=input.integer, defval=11)
//endYear  = input(title="End Year Backtest", type=input.integer, defval=2019)

// === INPUT BACKTEST RANGE ===
FromMonth = input(defval = 12, title = "From Month", minval = 1, maxval = 12)
FromDay   = input(defval = 1, title = "From Day", minval = 1, maxval = 31)
FromYear  = input(defval = 2016, title = "From Year", minval = 2017)
ToMonth   = input(defval = 1, title = "To Month", minval = 1, maxval = 12)
ToDay     = input(defval = 1, title = "To Day", minval = 1, maxval = 31)
ToYear    = input(defval = 9999, title = "To Year", minval = 2017)

// === FUNCTION EXAMPLE ===
start     = timestamp(FromYear, FromMonth, FromDay, 00, 00)  // backtest start window
finish    = timestamp(ToYear, ToMonth, ToDay, 23, 59)        // backtest finish window
window()  => true

usePosSize = input(title="Use Position Sizing?", type=input.bool, defval=true)
riskPerc   = input(title="Risk %", type=input.float, defval=0.5, step=0.25)

// 2. Calculate strategy values
fastMA = sma(close, fastMALen)
medMA  = sma(close, medMALen)
slowMA = sma(close, slowMALen)

//Position Sizing
riskEquity  = (riskPerc / 100) * strategy.equity
atrCurrency = (atr(20) * syminfo.pointvalue)
posSize     = usePosSize ? floor(riskEquity / atrCurrency) : 1

//Backtest Window
//tradeWindow = (time <= timestamp(endYear, endMonth, 1, 0, 0))

// 3. Determine long trading conditions
enterLong = crossover(fastMA, medMA) and
     (fastMA > slowMA) and (medMA > slowMA) and
     window()

exitLong = crossunder(fastMA, medMA)

// 4. Code short trading conditions
enterShort = crossunder(fastMA, medMA) and
     (fastMA < slowMA) and (medMA < slowMA) and
     window()

exitShort = crossover(fastMA, medMA)

// 5. Output strategy data
plot(series=fastMA, color=color.green, title="Fast MA")
plot(series=medMA, color=color.purple, title="Medium MA")
plot(series=slowMA, color=color.red, title="Slow MA",
     linewidth=2)

bgColour =
     enterLong and (strategy.position_size < 1) ? color.green :
     enterShort and (strategy.position_size > -1) ? color.red :
     exitLong and (strategy.position_size > 0) ? color.lime :
     exitShort and (strategy.position_size < 0) ? color.orange :
     na

bgcolor(color=bgColour, transp=85)

// 6. Submit entry orders
if (enterLong)
    strategy.entry(id="EL", long=true, qty=1)

if (enterShort)
    strategy.entry(id="ES", long=false, qty=1)

// 7. Submit exit orders
strategy.close_all(when=exitLong and
     (strategy.position_size > 0))
strategy.close_all(when=exitShort and
     (strategy.position_size < 0))

strategy.close_all(when=not window())

//END
Detail
https://www.fmz.com/strategy/440690
Last Modified
2024-02-01 11:02:17
