Name
一种移动平均线指标策略-Moving-Average-Indicator-Strategy
Author
ChaoZhang
Strategy Description
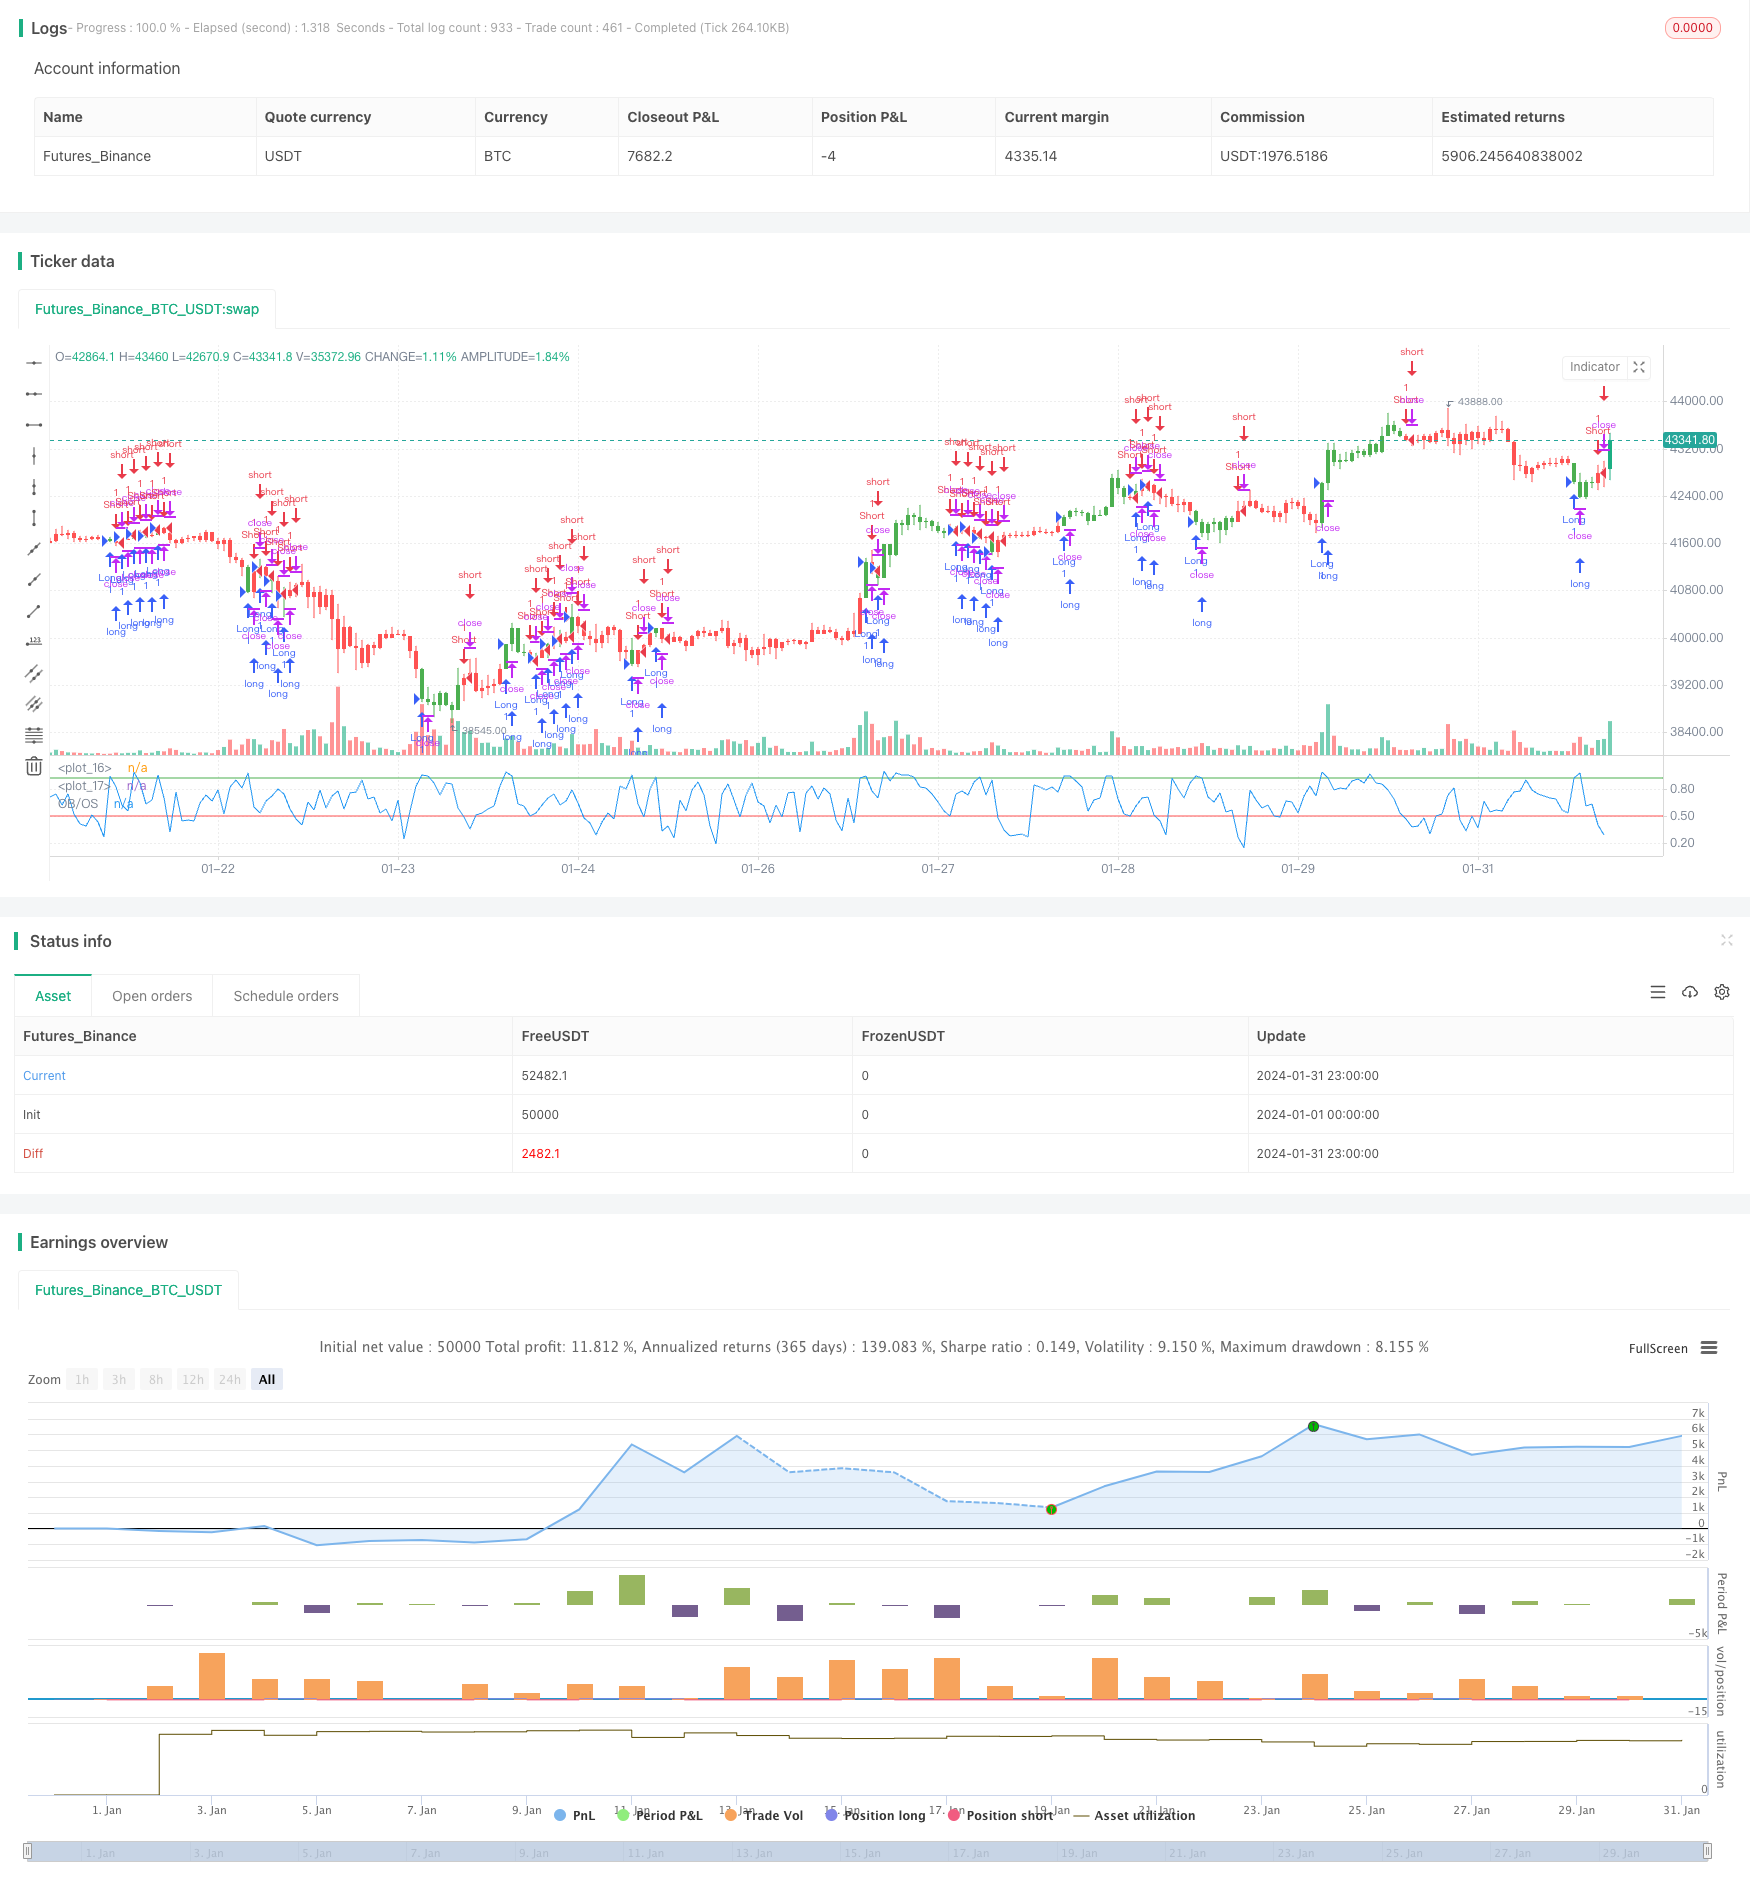
移动平均线指标策略是一种根据移动平均线判断市场趋势,并进行长仓或短仓操作的量化交易策略。该策略通过计算一定周期的收盘价平均值,判断市场是否处在超买或超卖状态,以捕捉价格反转机会。
该策略的核心指标是随机指数移动平均线(Stochastic Oscillator)。其计算方法是:
低点 = 最近N天的最低价中的最低值
高点 = 最近N天的最高价中的最高值
K值 = (当前close - 低点)/(高点 - 低点)* 100
其中,N值即为长度Length。该指标大体反映了当前收盘价相对最近N天价格范围的位置。
当K值大于超买线(BuyBand),表示股价可能超买,将发生回调;当K值小于超卖线(SellBand),表示股价可能超卖,将发生反弹。
根据这一判断规则,该策略会在超买区卖出开仓,在超卖区买入开仓。平仓条件则是指标线重新进入中间区域((SellBand, BuyBand))。
该策略具有以下优势:
- 使用移动平均线指标判断市场趋势,回测效果较好,容易形成交易信号
- 通过调整参数,可以灵活适应不同周期和品种
- 策略思路简单清晰,容易理解和优化
该策略也存在一些风险:
- 移动平均线容易产生错触现象,可能出现超买超卖信号被“甩”的情况
- 参数设置不当可能导致交易频繁或信号不明显
- 只考虑单一指标,可优化空间有限
可以通过适当优化指标参数,或增加过滤条件来减少这些风险。
该策略主要可以从以下几个方面进行优化:
- 增加volume或ATR等指标过滤,确保交易信号更可靠
- 加入多个周期的Stoch指标,进行组合运算生成信号
- 增加附加判断指标,如MACD、KDJ等,实现多指标聚合
- 对交易品种、周期、参数进行遍历优化,寻找最佳配置
移动平均线指标策略整体思路简单,使用广泛,回测效果较为稳定,适合作为量化交易的入门策略之一。但该策略考虑因素单一,可优化空间有限,仅适合短期操作。未来可通过多指标聚合、机器学习等手段进行升级。
||
The Moving Average Indicator strategy is a quantitative trading strategy that judges market trends based on moving averages and conducts long or short position operations. By calculating the average closing price over a period of time, this strategy determines whether the market is overbought or oversold in order to capture price reversal opportunities.
The core indicator of this strategy is the Stochastic Oscillator. Its calculation method is:
Low = the lowest low of the most recent N days
High = the highest high of the most recent N days
K value = (Current close – Low)/(High – Low)*100
Where N is the length Length. This indicator roughly reflects the position of the current closing price relative to the price range over the most recent N days.
When the K value is greater than the overbought line (BuyBand), it indicates that the stock may be overbought and a callback will occur. When the K value is less than the oversold line (SellBand), it indicates that the stock may be oversold and a rebound will occur.
According to this judgment rule, the strategy will sell to open a position in the overbought zone and buy to open a position in the oversold zone. The closing condition is that the indicator line re-enters the intermediate zone ((SellBand, BuyBand)).
This strategy has the following advantages:
- Using moving average indicators to determine market trends, good backtesting results, easy to form trading signals
- Flexible to adapt to different cycles and varieties by adjusting parameters
- The strategy idea is simple and clear, easy to understand and optimize
The strategy also poses some risks:
- Moving averages are prone to false touches, possibly being "whipsawed”
- Improper parameter settings can lead to frequent trading or unclear signals
- Only one indicator is considered, limited optimization space
These risks can be reduced by appropriately optimizing indicator parameters or adding filter conditions.
The main aspects that this strategy can be optimized include:
- Add volume or ATR and other indicators to ensure more reliable trading signals
- Add Stoch indicators of multiple cycles, generate signals through composite operations
- Increase additional judgment indicators such as MACD and KDJ to achieve multi-indicator aggregation
- Traverse and optimize trading varieties, cycles, parameters to find the optimal configuration
The overall idea of the Moving Average Indicator strategy is simple and widely used with relatively stable backtesting results, making it suitable as a beginner’s quantitative trading strategy. However, this strategy has limited optimization space as it considers limited factors and is only suitable for short-term operations. Future upgrades can be made through multi-indicator aggregation, machine learning, etc.
[/trans]
Strategy Arguments
| Argument | Default | Description |
|---|---|---|
| v_input_1 | 10 | Length |
| v_input_2 | 0.92 | BuyBand |
| v_input_3 | 0.5 | SellBand |
| v_input_4 | false | Trade reverse |
Source (PineScript)
/*backtest
start: 2024-01-01 00:00:00
end: 2024-01-31 23:59:59
period: 1h
basePeriod: 15m
exchanges: [{"eid":"Futures_Binance","currency":"BTC_USDT"}]
*/

//@version=2
////////////////////////////////////////////////////////////
//  Copyright by HPotter v1.0 25/09/2017
// Simple Overbought/Oversold indicator
//
// You can change long to short in the Input Settings
// WARNING:
// - For purpose educate only
// - This script to change bars colors.
////////////////////////////////////////////////////////////
strategy(title="Overbought/Oversold", shorttitle="OB/OS")
Length = input(10, minval=1)
BuyBand = input(0.92, step = 0.01)
SellBand = input(0.5, step = 0.01)
reverse = input(false, title="Trade reverse")
hline(BuyBand, color=green, linestyle=line)
hline(SellBand, color=red, linestyle=line)
xOBOS = stoch(close, high, low, Length)
nRes = iff(close > close[Length], xOBOS / 100, (100 - xOBOS) / 100)
pos = iff(nRes < SellBand, -1,
	   iff(nRes > BuyBand, 1, nz(pos[1], 0)))
possig = iff(reverse and pos == 1, -1,
          iff(reverse and pos == -1, 1, pos))
if (possig == 1)
    strategy.entry("Long", strategy.long)
if (possig == -1)
    strategy.entry("Short", strategy.short)
barcolor(possig == -1 ? red: possig == 1 ? green : blue )
plot(nRes, color=blue, title="OB/OS")
Detail
https://www.fmz.com/strategy/442815
Last Modified
2024-02-26 11:10:23
