Name
一目均衡图趋势追踪策略Ichimoku-Cloud-Trend-Following-Strategy
Author
ChaoZhang
Strategy Description
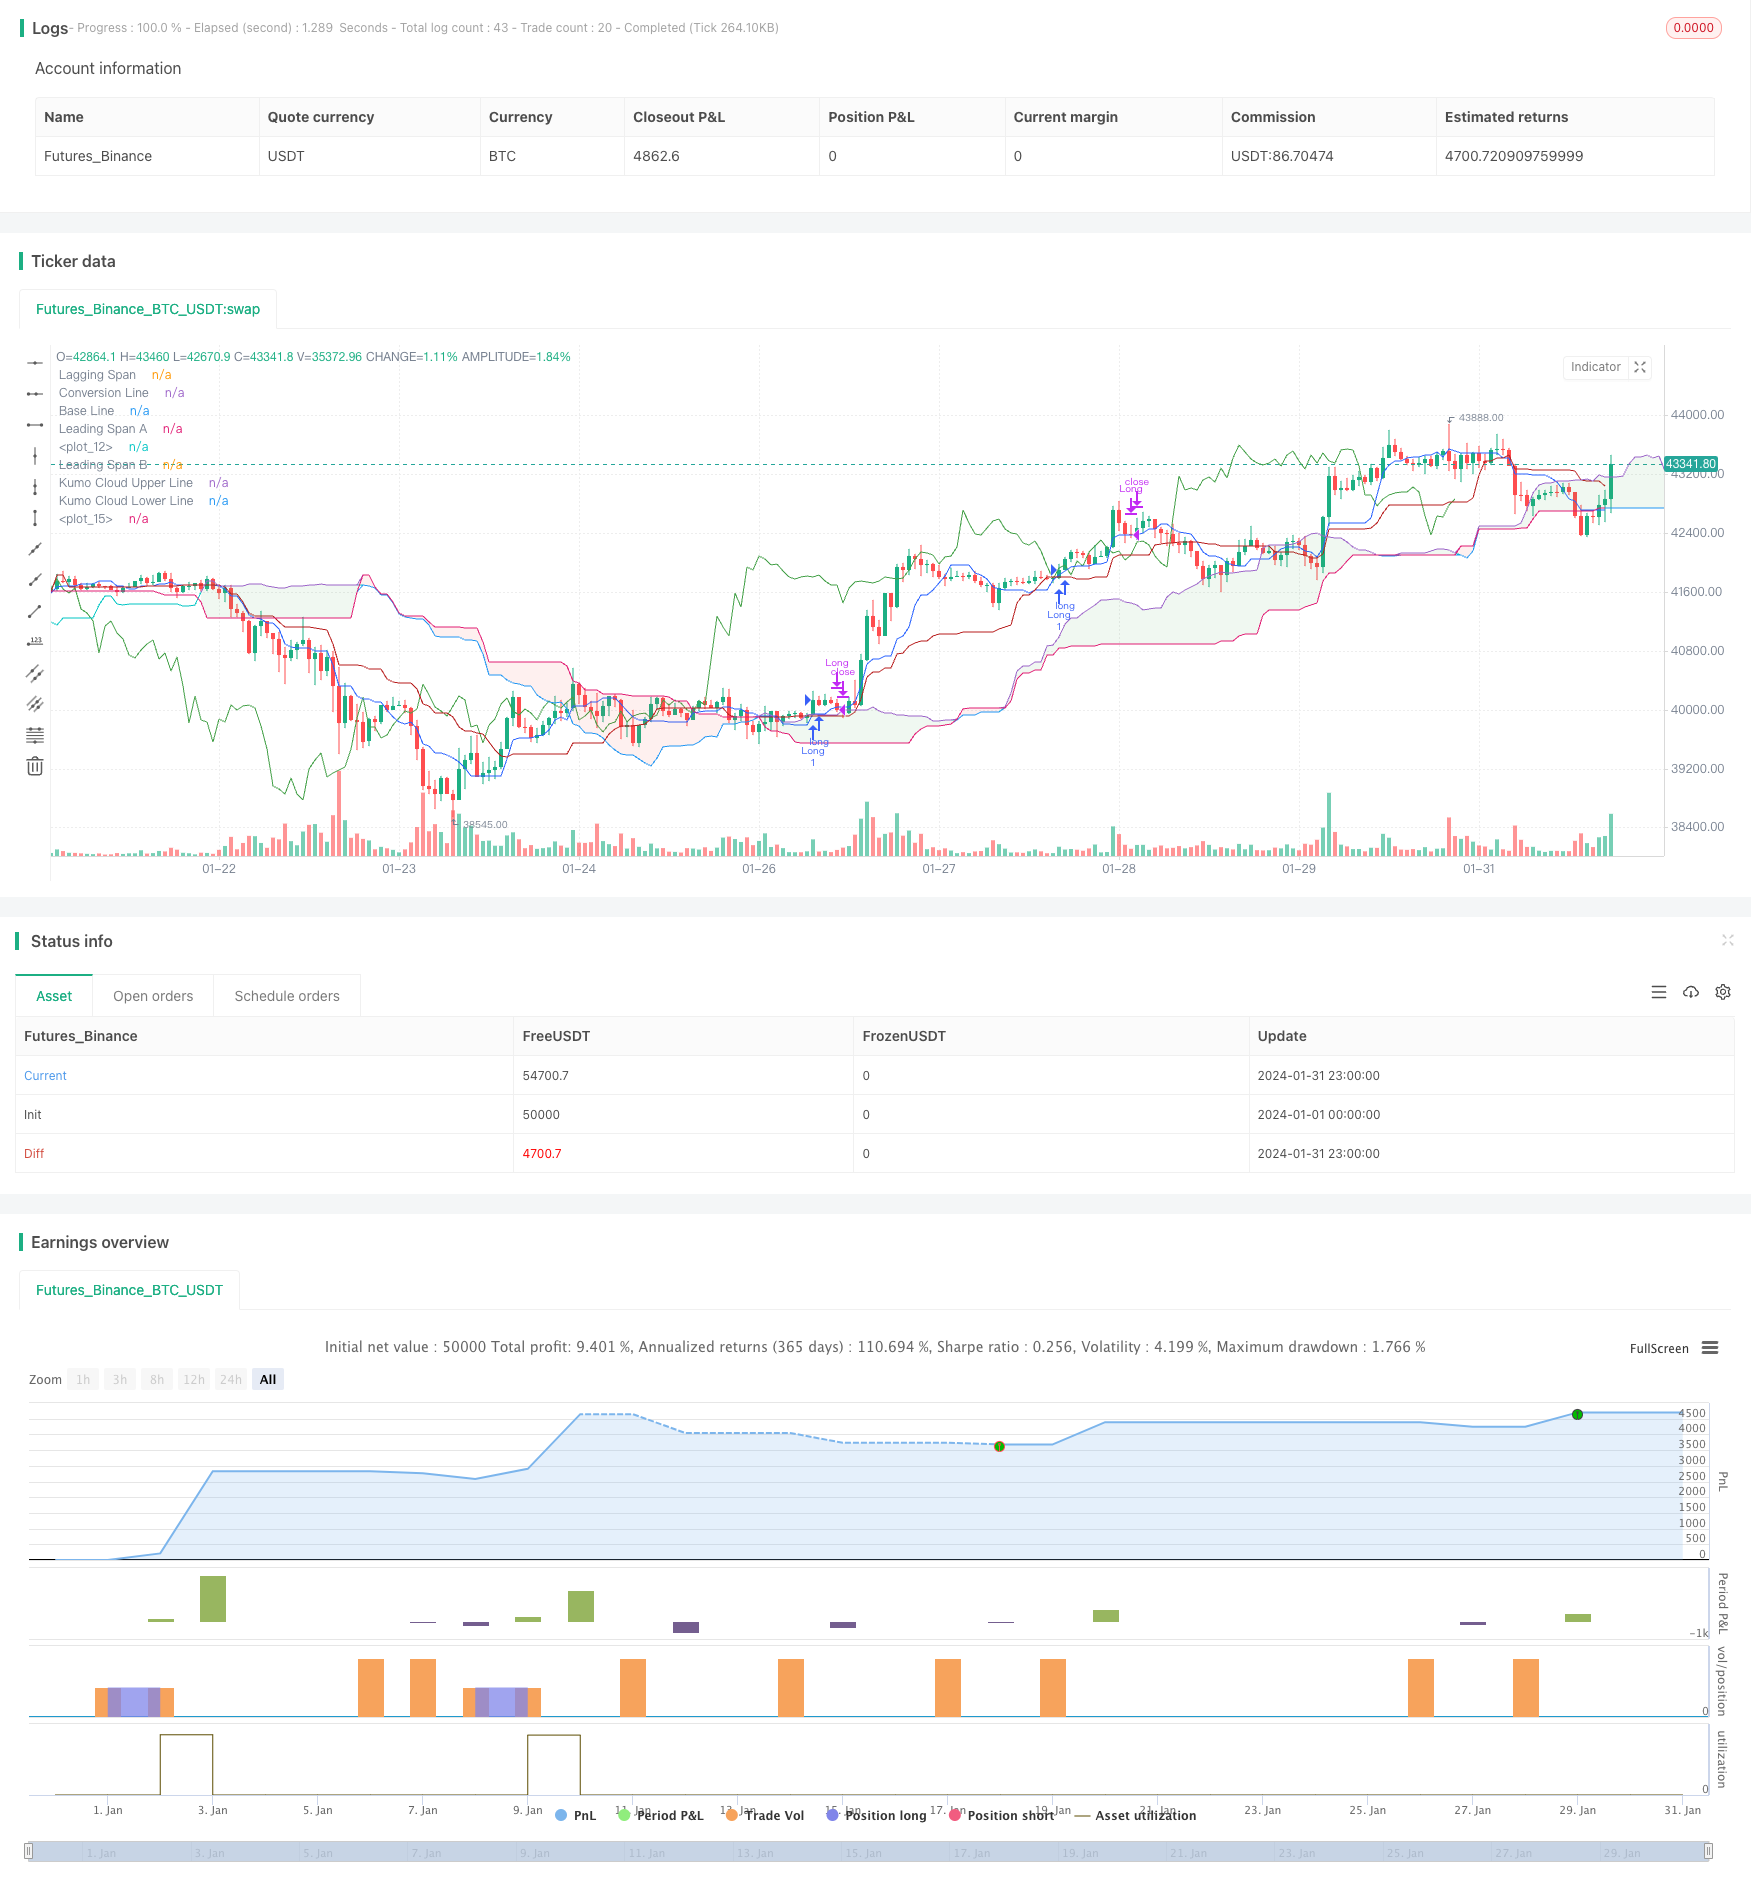
一目均衡图趋势追踪策略(Ichimoku Cloud Trend Following Strategy)是一种技术分析策略。它利用一目均衡图的五条指标线,判断市场趋势方向、支持阻力位和进场时机。
该策略的核心指标线包含:
- 转换线:最近9日高点与低点的平均值,反映短期趋势。
- 基准线:最近26日高点与低点的平均值,反映中长期趋势。
- 先行线A:转换线与基准线的平均值,位移26日,判断中期支撑与阻力。
- 先行线B:最近52日高点与低点的平均值,位移26日,判断长期支撑与阻力。
- 随动线:价格位移26日,反映趋势动量。
当转换线上穿基准线时为买入信号;下穿为卖出信号。随动线位于价格之上且云团颜色为绿色为多头趋势,否则为空头。
策略根据转换线和基准线的关系判断趋势方向。比如,转换线向上突破基准线则判断为进入多头,此时如果满足随动线高于价格的条件,则产生买入信号。
止损或止盈依据先行线A或基准线来设置。如果选择基准线止损,当价格跌破基准线时平仓。
该策略具有以下优势:
- 利用多指标综合判断,提高精确度。
- 先行线可提前判断支撑与阻力。
- 随动线验证趋势动量,防止虚假突破。
- 基准线作为中长期趋势指标,可减少噪音交易。
该策略主要风险在于容易产生虚假信号。优化建议:
- 调整平均周期参数,优化指标灵敏度。
- 添加其他指标或图形过滤,如MACD、布林带。
- 降低交易频率,追踪中长线趋势。
一目均衡图策略综合多指标判断市场走势,既考量短期动量,也重视中长期趋势。转换线与基准线的关系判断市场买卖时机,基准线作为止损线锁定利润,可有效控制风险。该策略适合中长线追踪趋势交易。
||
The Ichimoku Cloud trend following strategy is a technical analysis strategy. It uses the five indicator lines of the Ichimoku Cloud to determine market trend direction, support/resistance levels, and entry timing.
The core indicator lines include:
- Conversion Line: The 9-day average of highest high and lowest low, reflecting short-term trend.
- Base Line: The 26-day average of highest high and lowest low, reflecting medium to long term trend.
- Leading Span A: The average between the conversion and base lines, shifted forward 26 days, judging medium-term support and resistance.
- Leading Span B: The 52-day average of highest high and lowest low, shifted forward 26 days, judging long-term support and resistance.
- Lagging Span: The price shifted backward 26 days, reflecting trend momentum.
Buy signal triggered when conversion line crosses above base line. Sell signal triggered when crossing below base line. Lagging span above price and green cloud color indicates bull trend.
It judges trend direction based on the relationship between conversion and base line. For example, when conversion line breaks out base line upwards, it signals a bull trend. If lagging span is also above price, long entry triggered.
Set stop loss or take profit based on Leading Span A or Base Line. If Base Line is chosen for stop loss, close position when price breaks below Base Line.
The advantages include:
- Utilize multiple indicators for higher accuracy.
- Leading Span anticipates support/resistance levels.
- Lagging Span verifies momentum to avoid false breakouts.
- Base Line as medium/long term indicator reduces noise.
Main risk is false signals. Suggested optimizations:
- Adjust average periods to fine tune sensitivity.
- Add other filters like MACD, Bollinger Bands.
- Lower trading frequency to follow mid/long term trend.
Ichimoku Cloud combines indicators to judge market trend. It considers both short-term momentum and mid/long term trend. Conversion and Base Lines determine trading signals. Base Line sets stop loss to lock in profits and control risks. This strategy suits mid/long term trend following.
[/trans]
Strategy Arguments
| Argument | Default | Description |
|---|---|---|
| v_input_int_1 | 9 | Conversion Line Length |
| v_input_int_2 | 26 | Base Line Length |
| v_input_int_3 | 52 | Leading Span B Length |
| v_input_int_4 | 26 | Lagging Span |
| v_input_string_1 | 0 | Choose Trail Line: ConversionLine |
Source (PineScript)
/*backtest
start: 2024-01-01 00:00:00
end: 2024-01-31 23:59:59
period: 1h
basePeriod: 15m
exchanges: [{"eid":"Futures_Binance","currency":"BTC_USDT"}]
*/

//@version=5
strategy(title="Ichimoku Cloud - BitBell", shorttitle="Ichimoku Cloud - BitBell", overlay=true)
conversionPeriods = input.int(9, minval=1, title="Conversion Line Length")
basePeriods = input.int(26, minval=1, title="Base Line Length")
laggingSpan2Periods = input.int(52, minval=1, title="Leading Span B Length")
displacement = input.int(26, minval=1, title="Lagging Span")
donchian(len) => math.avg(ta.lowest(len), ta.highest(len))
conversionLine = donchian(conversionPeriods)
baseLine = donchian(basePeriods)
leadLine1 = math.avg(conversionLine, baseLine)
leadLine1bbbbb = math.avg(conversionLine, baseLine)[displacement - 1]
plot(leadLine1bbbbb)
leadLine2 = donchian(laggingSpan2Periods)
leadLine2bbbbbb = donchian(laggingSpan2Periods)[displacement - 1]
plot(leadLine2bbbbbb)

support = leadLine1bbbbb > leadLine2bbbbbb
Resistance = leadLine1bbbbb < leadLine2bbbbbb


TrailStop = input.string(title='Choose Trail Line', options=["ConversionLine", "BaseLine"], defval="ConversionLine")


var stopLong = 0.0
var stopShort = 0.0
var TagetLong = 0.0
var TargetShort = 0.0


if close > leadLine1bbbbb and close > leadLine2bbbbbb and conversionLine[1] <= baseLine[1] and conversionLine > baseLine and close > conversionLine and support
	strategy.entry("Long",strategy.long)
	stopLong := conversionLine
// if close < stopLong and strategy.position_size > 0
// 	strategy.close("Long")
// 	stopLong := 0.0
if (close < conversionLine and strategy.position_size > 0) and (TrailStop == 'ConversionLine')
	strategy.close("Long")
	stopLong := 0.0
if (close < baseLine and strategy.position_size > 0) and (TrailStop == 'BaseLine')
	strategy.close("Long")
	stopLong := 0.0

if close < leadLine1bbbbb and close < leadLine2bbbbbb and conversionLine[1] >= baseLine[1] and conversionLine < baseLine and close < conversionLine and Resistance
	strategy.entry("Short",strategy.short)
	stopShort := conversionLine
// if close > stopShort and strategy.position_size < 0
// 	strategy.close("Short")
// 	stopShort := 0.0
if (close > conversionLine and strategy.position_size < 0) and (TrailStop == 'ConversionLine')
	strategy.close("Short")
	stopShort := 0.0
if (close > baseLine and strategy.position_size < 0) and (TrailStop == 'BaseLine')
	strategy.close("Short")
	stopShort := 0.0
// if close >= 1.0006 * strategy.position_avg_price and strategy.position_size > 0
// 	strategy.close("Long")
// 	stopLong := 0.0
plot(conversionLine, color=#2962FF, title="Conversion Line")
plot(baseLine, color=#B71C1C, title="Base Line")
plot(close, offset = -displacement + 1, color=#43A047, title="Lagging Span")
p1 = plot(leadLine1, offset = displacement - 1, color=#A5D6A7,
	 title="Leading Span A")
p2 = plot(leadLine2, offset = displacement - 1, color=#EF9A9A,
	 title="Leading Span B")
plot(leadLine1 > leadLine2 ? leadLine1 : leadLine2, offset = displacement - 1, title = "Kumo Cloud Upper Line", display = display.none)
plot(leadLine1 < leadLine2 ? leadLine1 : leadLine2, offset = displacement - 1, title = "Kumo Cloud Lower Line", display = display.none)
fill(p1, p2, color = leadLine1 > leadLine2 ? color.rgb(67, 160, 71, 90) : color.rgb(244, 67, 54, 90))
Detail
https://www.fmz.com/strategy/442964
Last Modified
2024-02-27 16:41:02
