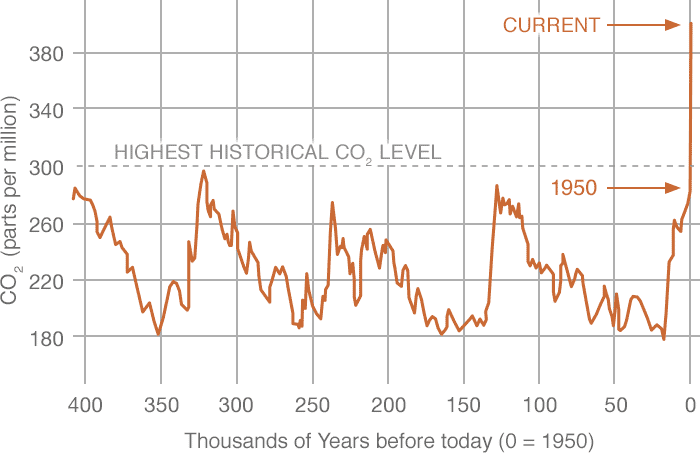
What is the evidence for a changing climate? In this unit, we will examine some of the most important indicators of global climate change: including CO2 concentration, global mean temperature, sea level rise, land ice sheet melt, and arctic sea ice cover. We will wrangle a wide range of tabular data file formats used by NOAA and other agencies and introduce the fundamentals of data visualization with ggplot2 and data processing with basic functions from the readr, tidyr, and dplyr packages as we seek to replicate the principle results of climate change over the last decades and also the past thousands of years. In particular, in this module we will recreate the now-famous "Hockey-stick" curve combining present and historical CO2 records from Petit et al (1999, Nature).
- author: Carl Boettiger (@cboettig)
- contact: [email protected]
- url: https://github.com/espm-157/climate-template
- date: 2018-12-18
- license: MIT, CC-BY
- copyright: Carl Boettiger
- package: https://github.com/espm-157/climate-template/archive/master.zip
- What is the evidence for a changing climate?
- How do find & intepret data sources behind main climate change indicators?
- How do we read and plot this data in a scriptable & reproducible manner?
- How do we communicate technical analysis in notebook formats that combine code, text, and visuals?
- Become familiar with a wide range of tabular data formats
- Become familiar reading data into R and generating plots in
ggplot - Demonstrate ability to use RStudio, GitHub, and Travis-CI workflow to demonstrate reproducible output.
- Demonstrate ability to communicate clearly in code, written text, and visual formats.
- Practice pair-coding, teamwork
tidyverseR- RStudio
- Typically also used to teach Git & GitHub.
- Open the notebook
assignment/climate.Rmdin RStudio - Work through the exercises described in the notebook.
- Optional extensions:
knit+ commit output files to GitHub- Enable Travis-CI on your repository
- This module has been developed for and delivered to both upper division undergraduate and first year graduate students at University of California Berkeley across a wide range of natural and social science fields. This module is typically delivered in a flipped classroom format, with basic concepts introduced through DataCamp videos and exercises in advance of each classroom session. More information at https://espm-157.carlboettiger.info
- This module is usually delivered over 2 weeks (3-6 class session).
The following DataCamp lessons are spread out over the instructional period in advance of the corresponding class session.