The emdbg library connects several software and hardware debugging tools together in a user friendly Python package to more easily enable advanced use cases for ARM Cortex-M microcontrollers and related devices.
The library orchestrates the launch and configuration of hardware debug and trace probes, debuggers, logic analyzers, and waveform generators and provides analysis tools, converters, and plugins to provide significant insight into the software and hardware state during or after execution.
The main focus of this project is the debugging of the PX4 Autopilot firmware running the NuttX RTOS on STM32 microcontrollers on the FMUv5x and FMUv6x hardware inside the Auterion Skynode. However, the library is modular and the tools are generic so that it can also be used for other firmware either out-of-box or with small adaptations.
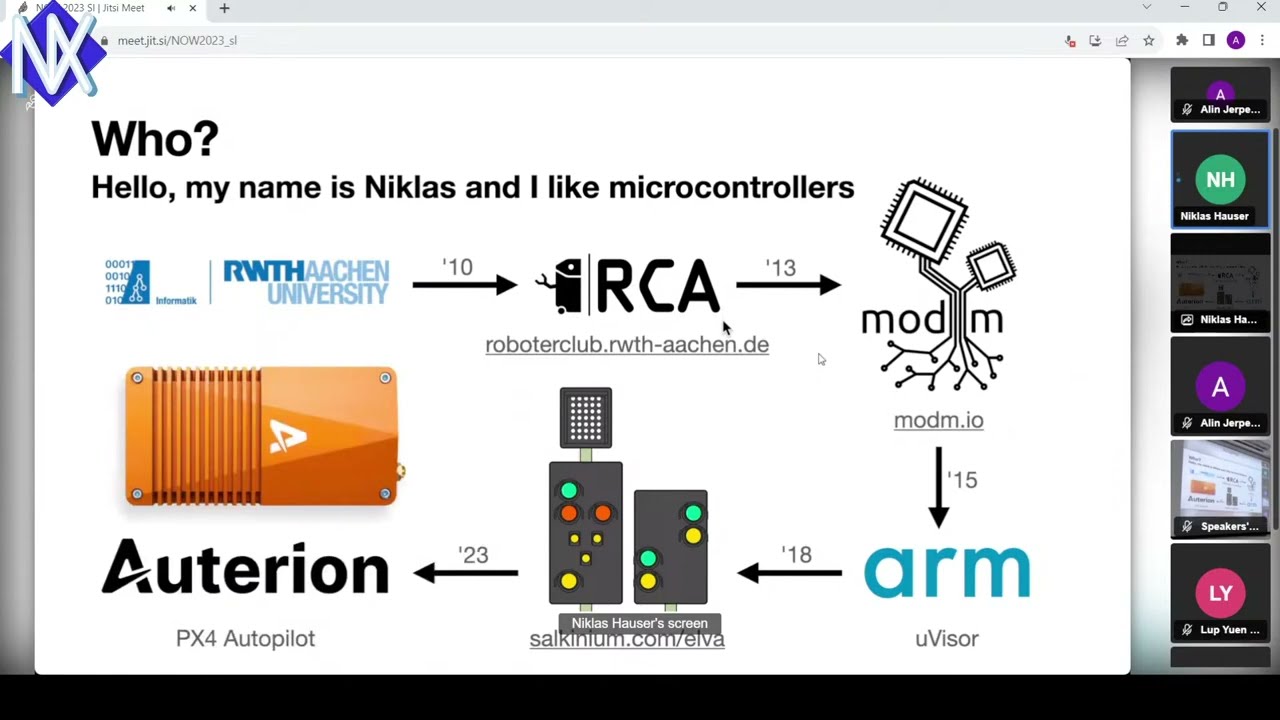
emdbg is maintained by @niklaut from Auterion.
- Debug Probes: SWD and ITM/DWT over SWO.
- SEGGER J-Link: BASE Compact (3MB/s), EDU Mini.
- STMicro STLink-v3 MINIE: (2MB/s).
- Orbcode ORBTrace mini: SWO (6MB/s).
- Coredump via CrashDebug with support for PX4 Hardfault logs.
- Trace Probes: ITM/DWT/ETM over TRACE.
- Orbcode ORBTrace mini: (50MB/s).
- GDB Debugger.
- Automatic management of debug probe drivers.
- Remote interfacing via GDB/MI and RPyC.
- Plugins via GDB Python API.
- User commands for PX4 and NuttX.
- Hardfault trapping with immediate backtrace.
- Real-time instrumentation using ITM/DWT.
- Visualization of entire RTOS state via perfetto.
- Nanosecond resolution with very little runtime overhead.
- Real-time instruction trace using ETM.
- Visualization of callstacks via perfetto.
- Generation of metrics from trace via PerfettoSQL.
- Patch Manager for out-of-tree modifications.
- Power Switch.
- Yocto USB Relay.
- Logic Analyzer and Waveform Generator.
- Digilent Analog Discovery 2 via Python API.
- Glasgow Digital Interface Explorer (planned).
- Serial Protocols.
- NuttX NSH command prompt.
- Hardware configuration.
A number of GDB and NSH scripting examples for test automation can be found in
the scripts folder.
Sorted in reverse chronological order.
Presented at Auterion by Lukas von Briel on 2024-10-31.
Presented at emBO++ by Niklas Hauser on 2024-03-15.
Presented at the PX4 Developer Summit by Niklas Hauser on 2023-10-22.
Presented at the NuttX International Workshop by Niklas Hauser on 2023-09-29.
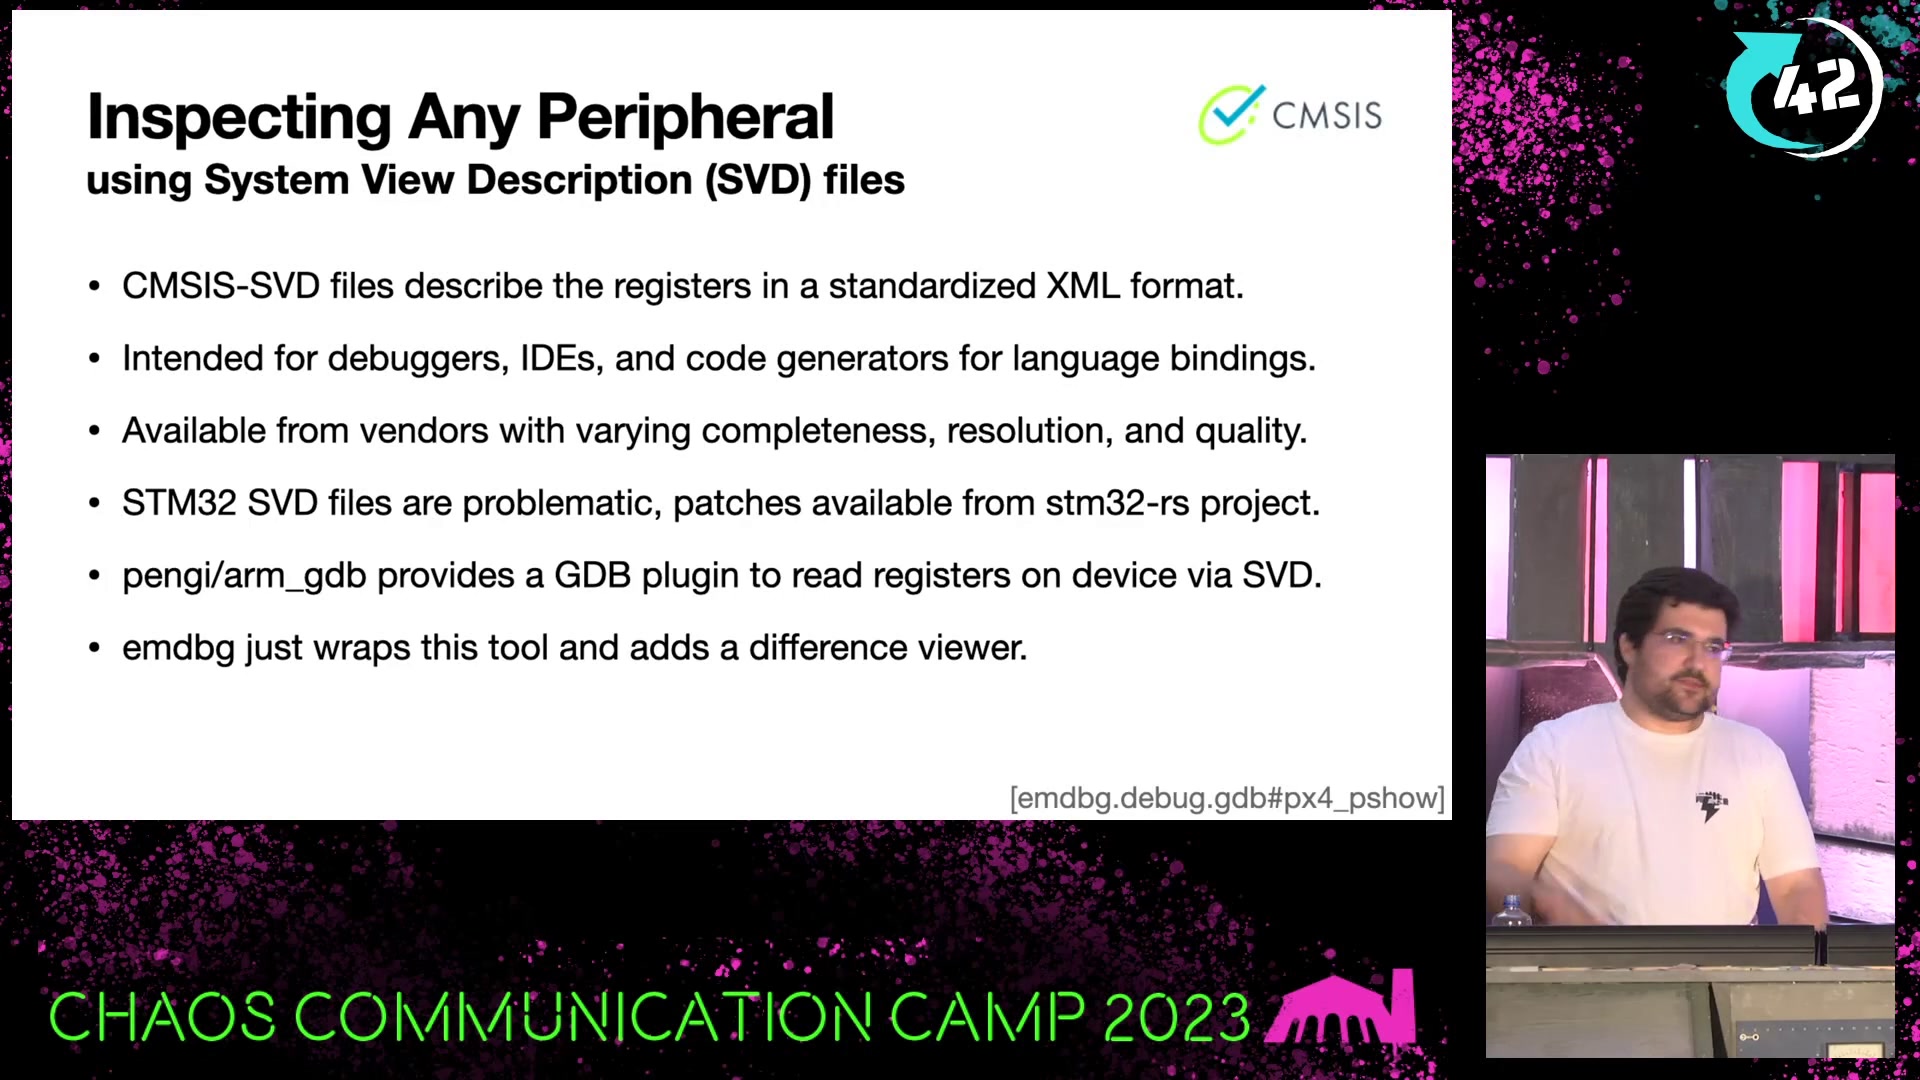
Presented at Chaos Communication Camp by Niklas Hauser on 2023-08-18.
The latest version is hosted on PyPi and can be installed via pip:
pip3 install emdbgYou also need to install other command line tools depending on what you use:
- Debugger:
arm-none-eabi-gdb-py3. - Debug probes: J-Link, OpenOCD, CrashDebug.
- Analysis: graphviz
Most modules have their own command-line interface. This library therefore has
many entry points which can be called using python3 -m emdbg.{module}.
The individual command line usage is documented in each module.
The most important modules are emdbg.debug.gdb and emdbg.bench.fmu:
For example, launching GDB with TUI using a J-Link debug probe:
python3 -m emdbg.debug.gdb --elf path/to/firmware.elf --ui=tui jlink -device STM32F765IIMost important user guides are available as Markdown files in the repository. You can browse the latest API documentation online at auterion.github.io/embedded-debug-tools.
For development, checkout the repository locally, then install with the -e
flag, which symlinks the relevant files into the package path:
cd embedded-debug-tools
pip3 install -e ".[all]"
You can also work on the documentation locally via pdoc:
pdoc emdbg
# pdoc server ready at http://localhost:8080


